
Check out our new platform: https://thecapital.io
According to the last investing news, The Federal Reserve meets on Wednesday for the last time before the November 3 presidential election and investors remain hopeful for more information on its decision to tolerate higher inflation.
Markets will also pay close attention to August US retail sales data released on Wednesday and initial jobless claims figures a day later.
Stock volatility last week could continue as the long-awaited fiscal aid package has stalled in the Senate and elections are looming. In the UK, the government is going to start debating its controversial internal markets bill that could ruin its EU divorce treaty.
Meanwhile, the Bank of England and the Bank of Japan will hold their monetary policy meetings on Thursday a few hours after the Fed. Then, this is what you need to know to start your week.
Hash Rate Pushes To New High
The Bitcoin network hash rate has proved resilient, says TheBlock and Glassnode, despite limited price increases since the halving in May of this year. After the halving, bitcoin miners receive reduced rewards for mining activities. The hash rate, however, has reached a new all-time high meaning miners are taking on increased costs in computing activities, or new efficiency gains have made mining more cost-effective.
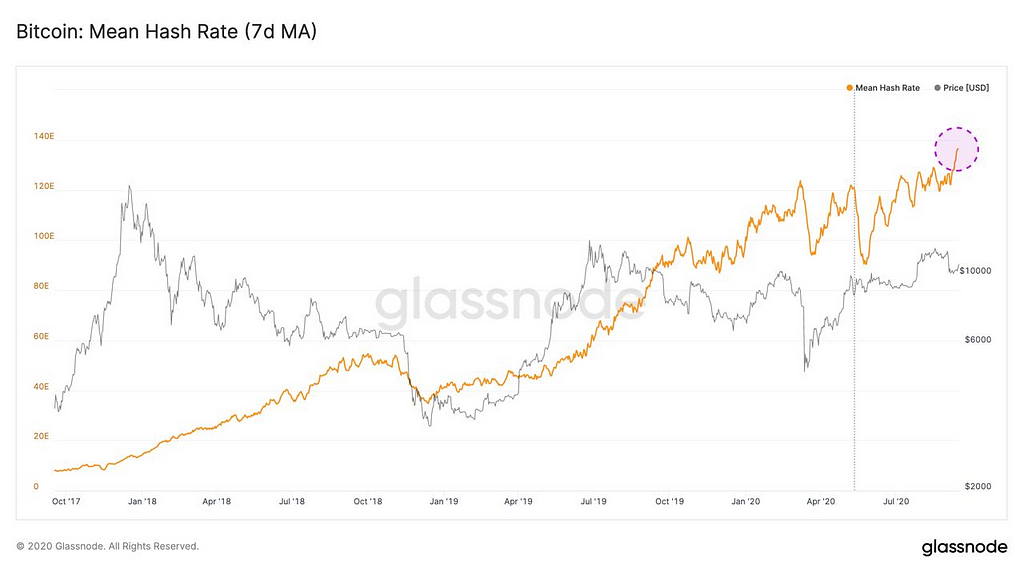
In the figure above, Bitcoin network hash rate over time. As shown, around the COVID-19 sell-off, the bitcoin network hash rate declined as mining revenues fell on market price reductions in bitcoin. However, since this time the hash rate has continued a steady increase to reach a new all-time high this past week.
Traders Spiked The Rally
IntoTheBlock categorizes as traders those addresses that have been holding a crypto-asset for less than 30 days, as it says The Defiant last narrative. As demand for Ethereum and DeFi protocols has risen significantly over the past few months, the number of ETH traders has been hitting yearly highs for three consecutive months. This trend broke in September as prices incurred a sharp correction.
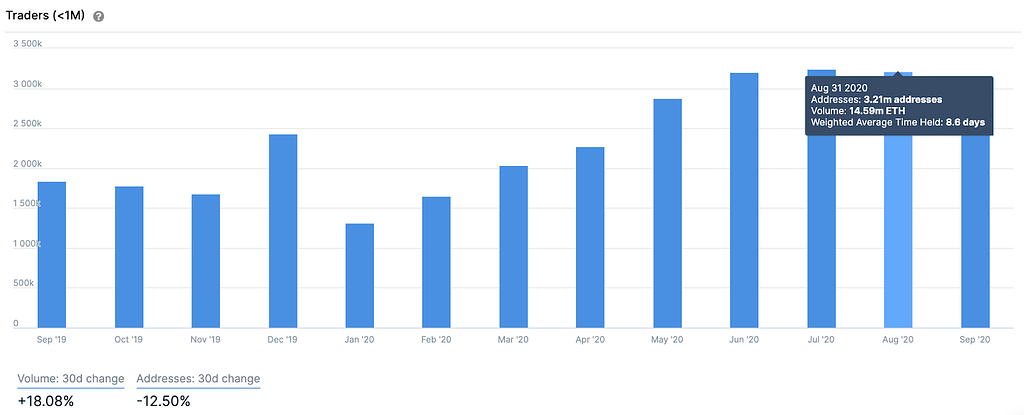
While the number of addresses with a holding period of under one month hit a yearly high by the end of July, the volume of ETH held by traders continued to rise into August. With 14.59 million ETH being held by traders, approximately 13% of the circulating supply changed hands within thirty days, the highest in over two years. This would suggest that speculative activity had been rising along with ETH’s price.
Locked In Smart Contracts
With the rise of DeFi protocols, says the last Glassnode report— especially those which offer yield farming and liquidity mining — the utility of ETH has never been higher. Rather than passively holding, investors are locking up their ETH in all kinds of smart contracts in order to generate returns.
As a result, over 15% of all ETH is locked in smart contracts on Ethereum right now — up from 11.5% a year ago.
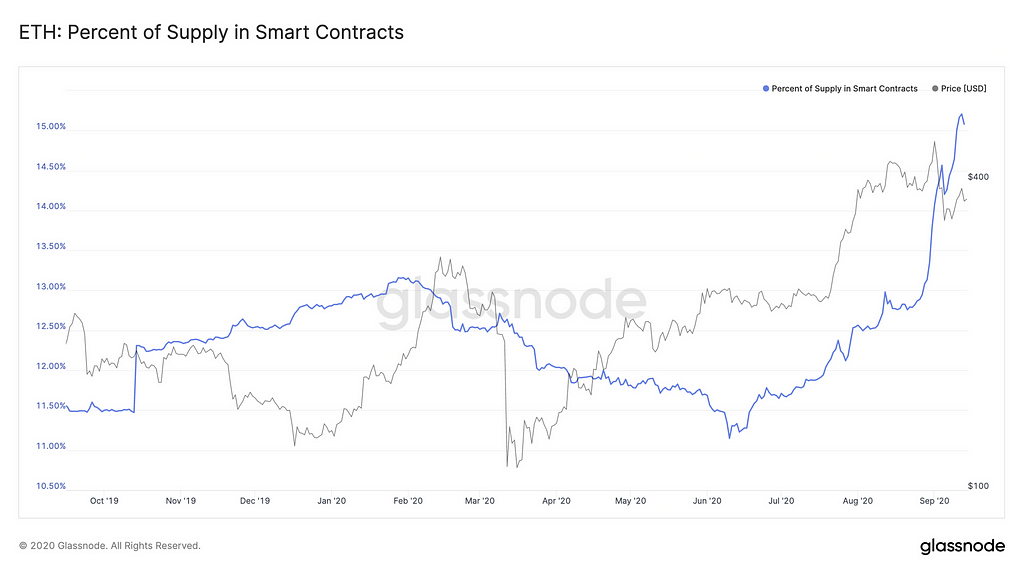
Over 5% of ETH is locked up in the WETH (wrapped ether) smart contract, enabling it to interact with other tokens more easily.
Most of this WETH has then been locked up in DeFi contracts, including Maker, Uniswap, and Balancer. Aside from DeFi use cases via WETH, the largest ETH balances in smart contracts are for exchange multisigs (e.g. Bitfinex and Gemini) and Compound’s ETH pool.
While exchange multisigs simply represent custodial passive holding, the other contracts (WETH, Compound, etc.) are all examples of how ETH is moving beyond the simple “store of value” use case.
The growing presence of ETH in these contracts represents its increasing utility — as a currency, a hedge, and a Schelling point for liquidity provision, ends to say the narrative.
Custody Security Prevail
The last Derebit report says that a survey of 800 institutions by Fidelity Digital Assets, revealed that more than 80% of respondents see the appeal of crypto trading, with one third already having some exposure to the asset class.
Moreover, Greyscale’s fund reported more than $1.4- billion inflow in the first half of 2020 alone. 81% of its investors being institutional clients.
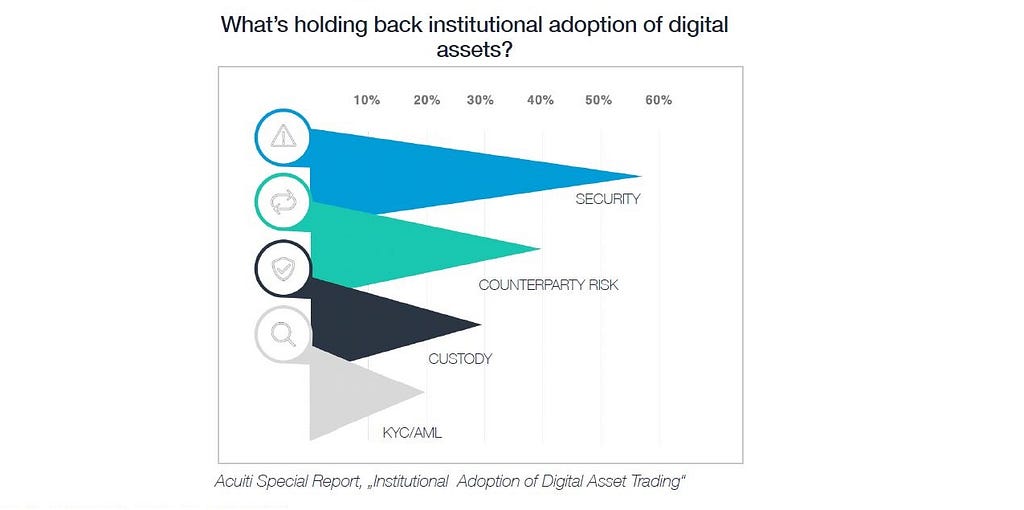
The research by Acuiti revealed that the main concerns of institutional clients are exchange security, counterparty risk, and custody. Therefore, it is no surprise that already more than 100 custody and settlement network firms are competing to eliminate these hurdles.
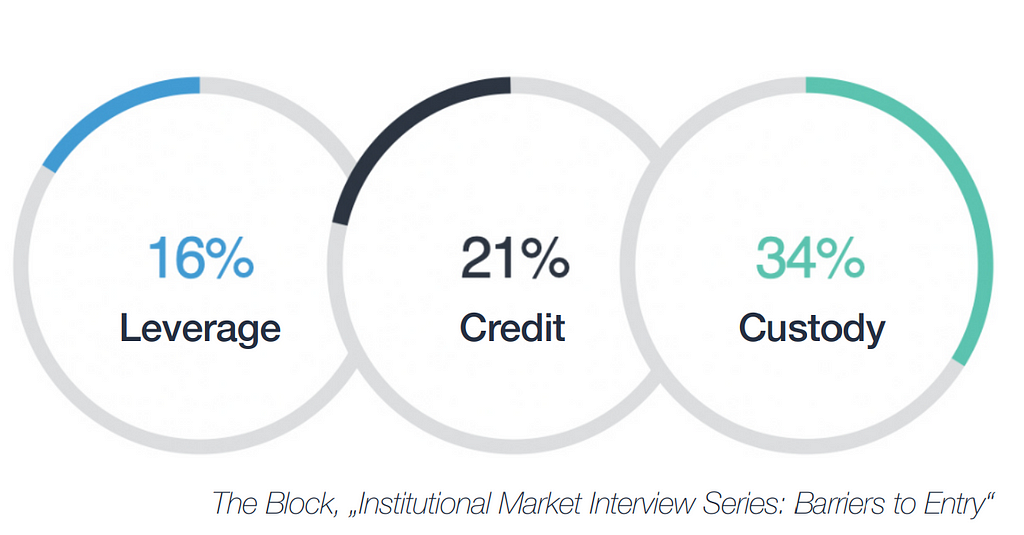
However, the varying opinions about what should be the industry standard might hinder widespread adoption and subsequentially slow down the speed of market growth.
Investors Accumulating
Unlike the other transactions, the report revealed something interesting about transfer scales of above 1,000 BTC, known as real whales, says the last cryptopotato news.
Transactions between 1,000 and 5,000 BTC were at their highest levels in mid-March when prices were low. This was followed by another significant spike in May when Bitcoin started trading near the $10,000 region.
The report further revealed that massive transfers between 5,000 and 10,000 BTC “saw repeated spikes from mid-May to the end of mid-July of this year,” during Bitcoin’s price consolidation. This reiterates the report published in July that Bitcoin whales have been accumulating 50,000 BTC every month.
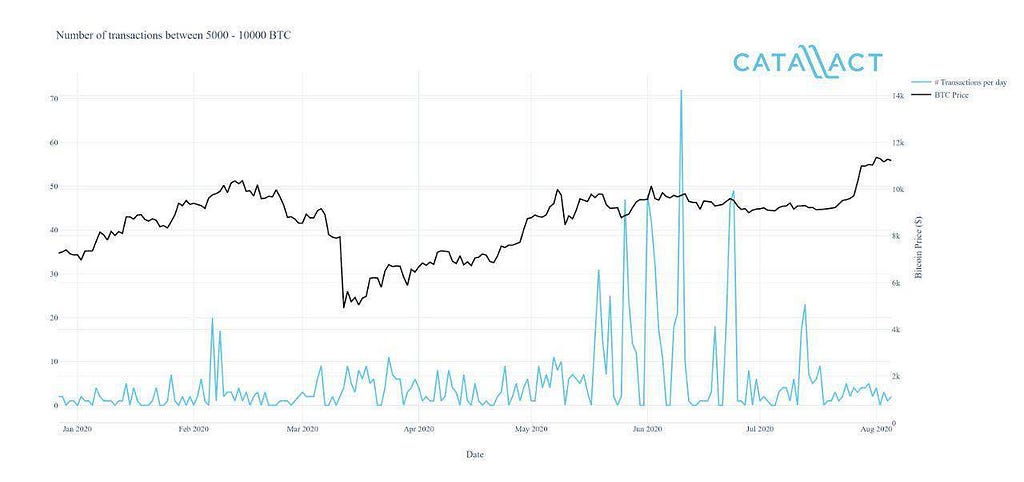
Considering the possible reasons for the upward trends of whale transactions between 5,000 and 10,000 BTC, the report suggests it could be exchanges transactions or institutions and large investors accumulating or distributing their assets during the consolidation period, hoping that the price would either increase further or decrease.
While the collaboration is only speculative since on-chain data cannot reveal everything, several previous papers on CryptoPotato, confirm that institutions have shown a significant interest in Bitcoin and cryptocurrencies this year.
Grayscale Investments, for instance, has been on a Bitcoin buying spree since mid-Q1, bringing its AUM to over 401,385 BTC. In May, the digital asset management company was in the headlines for buying more coins that have been mined since the third halving.
Stock to Flow Deflection
According to a recent Glassnode update and ambcrypto, Bitcoin’s Stock to Flow Deflection has registered a 5-month low of 0.596. The S2F deflection indicates the ratio between the present Bitcoin price and the S2F model. If the value is under 1 (as it is currently) then, according to Stock-to-Flow, it is currently undervalued.
However, as we approach the last quarter of the year, the deviation of Bitcoin from the S2F might significantly increase.
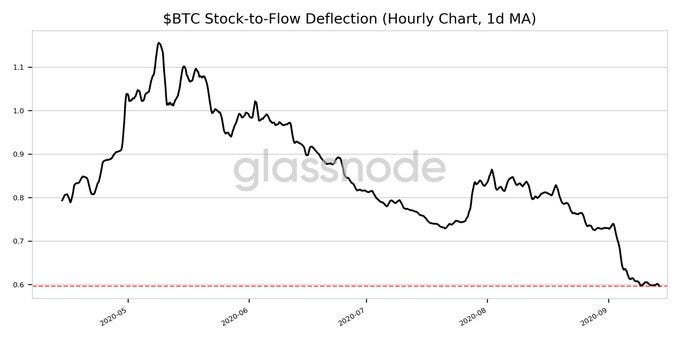
As observed in the attached chart, Bitcoin has been overvalued and above the S2F ratio for only a brief period since 2017. If current levels are expected to be followed, Bitcoin needs to be valued at $17,060 by 1 October. That is a huge ask, one that would require Bitcoin to climb steeply by almost $7000 in just two weeks.
However, that isn’t the main argument. The fact of the matter is that Bitcoin continues to lag behind the model, which is why the curve to meet the next targets are getting steeper and steeper by the week.
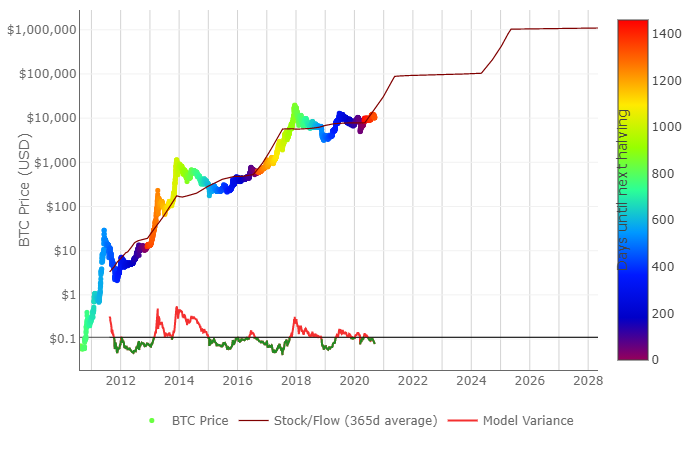
According to a recent analysis, the original S2F model suggested that Bitcoin would need to trade above $20K in May 2021, above $30K in September 2021, and above $50K in January 2022.
However, according to the revised version released by PlanB, the S2FX model, the targets have been given an impetus, with the revised targets including $30k by May 2021, $90K by September 2021, and $200K by January 2022.
In short, Bitcoin would need to tail from just over $10,000, at the time of writing, to $200,000 by January 2022, to validate the theory of the S2F model.
However, as difficult as it may sound, it cannot be completely dismissed. After all, in terms of growth, it is the same as Bitcoin’s rise from $1,000 to $20,000 back in 2017. Hence, it isn’t illogical.

Keeping that in mind, it is also important to note that Bitcoin’s halving cycle is yet to impact its price in a parabolic manner, as it has in the past, which is why the probability of meeting those targets is still in sight.
With the cryptocurrency’s present market price undervalued, under a rough estimation, the minimum value that Bitcoin needs to touch is $18,000 by the end of December 2020 for the S2F deflection value to be above 0.5.
The actual desired value is $30,833 on 1 January, hence, any price point for Bitcoin under $18,000 will only invalidate the rationality of the Stock-to-Flow model.
Volatility And Correlation
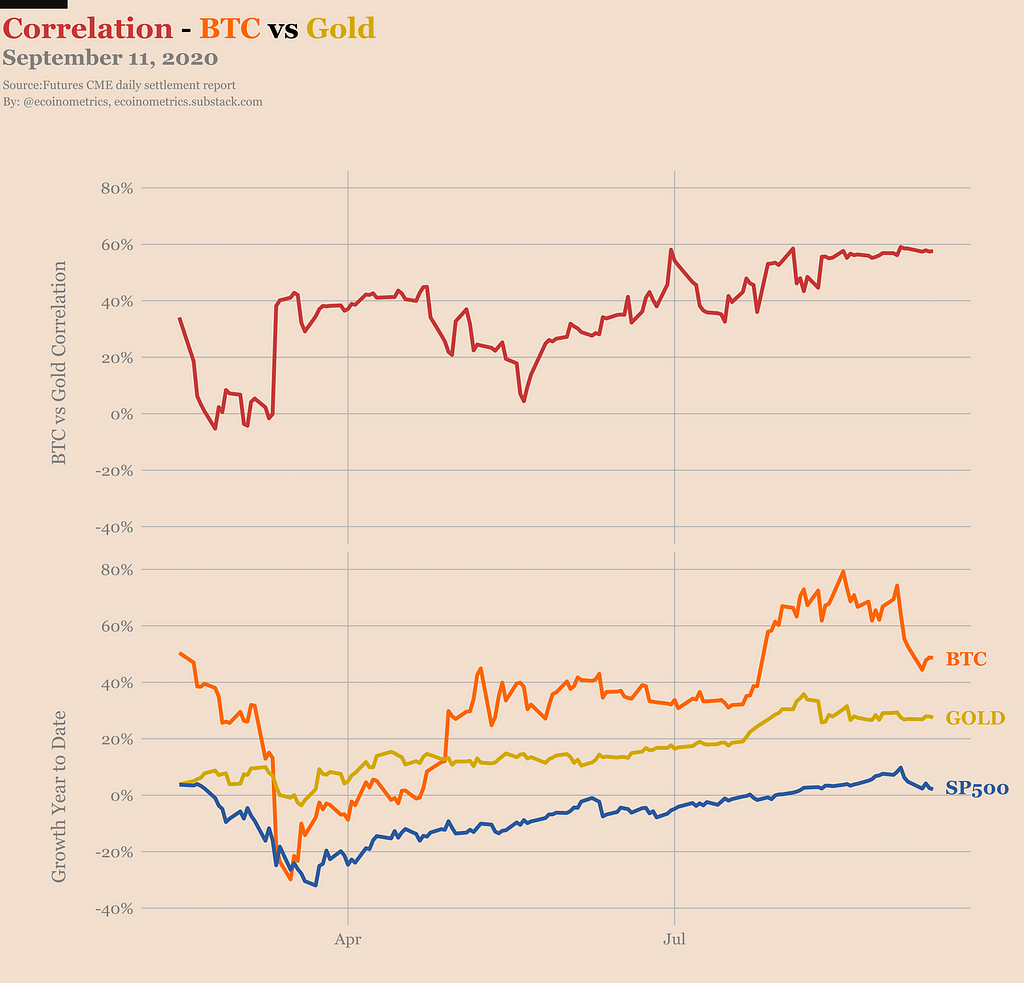
ecoinometrics says that Bitcoin is better at being gold than gold itself. Investors see Bitcoin as the store of value of the future and that’s driving a lot of the behaviours we see in the market.
Pretty much since the liquidity event of February, the correlation is on an upward trajectory. And now these two assets are positively correlated at 60% on a 30 days basis.
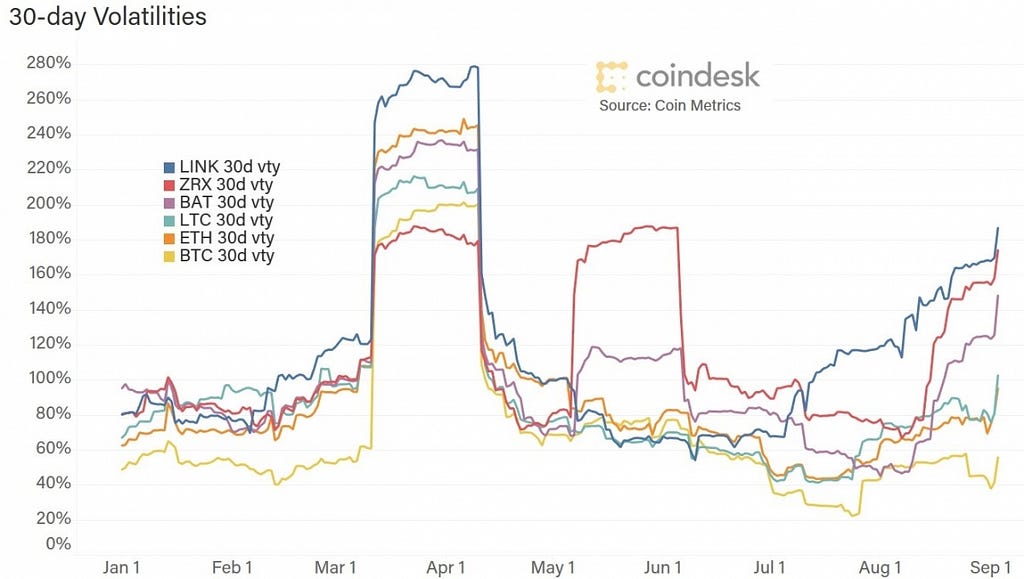
However, Coinmetrics says that As the summer of DeFi rages on price action around Bitcoin has been relatively subdued. Realized volatility remains around 50%.
This is interesting because in the past when Bitcoin broke out of this range into more volatile trading this measure reached levels over 100%. However, this past breakout did not reach nearly as elevated levels with the rolling 30-day average not surpassing the 60% mark.
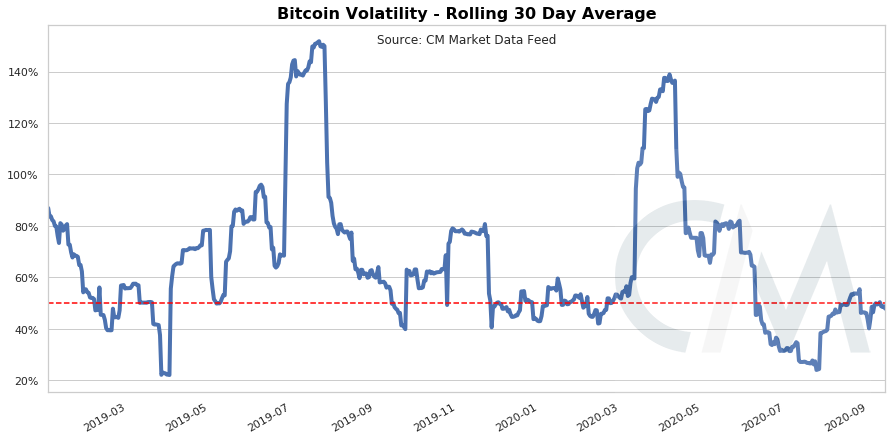
This is potentially due to a reduction in leveraged Bitcoin positions relative to the market size or a growing efficiency in the price action of the markets.
Another point says that another sign of growing efficiencies in the market is the reduction of offset seen between the market value of Tether and the U.S. Dollar.
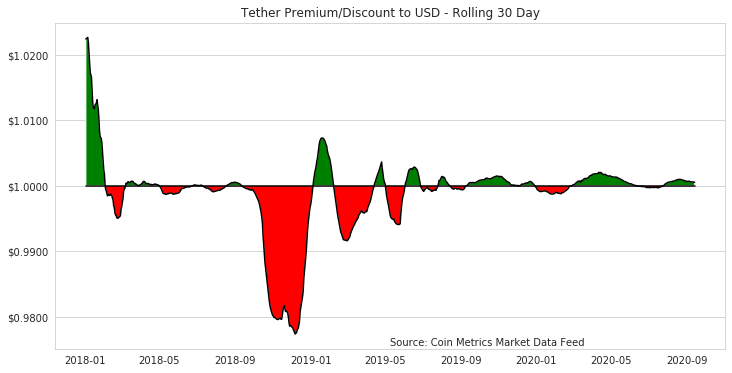
This chart above shows a rolling 30-day average price of Tether since 2018. You can observe that in 2018 and 2019 there were periods with large differences between the two and that this offset has been reduced over time.
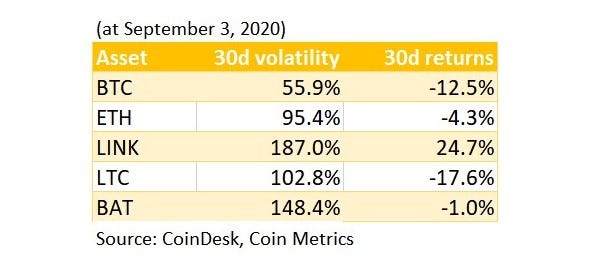
On the side of coindesk, we can look that for instance, the 30-day volatilities of ether (ETH) and litecoin (LTC) have been similar, while the returns over the same period have been notably different.
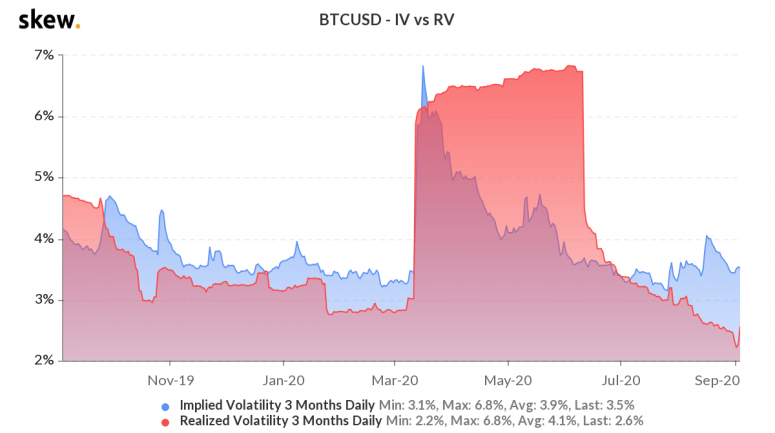
Also, the narrative says that volatility is higher than realized volatility, which tells us that investors expect volatility to increase.
The implied-realized differential has been positive in the past, but earlier this week it reached its widest point in over a year. That’s the market saying “buckle up.”
Waiting For The Answer
All the media are watching the meeting next Wednesday that the Fed will hold. Perhaps when you read this article, the words would already be on the table. But as Investing explains, everything points to the Fed, which wraps up its two-day monetary policy meeting on Wednesday, making some minor adjustments to its interest rate announcement after taking a new approach last month to hit its target. inflation of 2%.
The Fed’s decision to tolerate periods of higher inflation means that interest rates will remain lower for some time to come.
The Fed will also update its projections on the economic and interest rate outlook, known as the dot chart, which will include forecasts for 2023 for the first time.
“I think the 2023 points will get everyone’s attention,” said Jon Hill, interest rate strategist at BMO Capital Markets.
Fed Chairman Jerome Powell said earlier this month that while the central bank will keep its foot on the monetary policy accelerator, lawmakers also have to contribute to the recovery, making the lack of a new fiscal policy package is increasingly worrying for some investors.
Values Could Continue
Also, the main investing news for this week says that some investors are concerned that last week’s stock market volatility — which sent the Nasdaq down as much as 10% from its highs and rocked other indices — is the beginning of an even bigger sell that will take the market off course after a six-month rally.
However, other investors believe the recent slide is a healthy consolidation after an impressive five-month rally in the S&P 500 that was driven by a small group of heavyweight tech companies and huge amounts of fiscal and monetary stimulus.
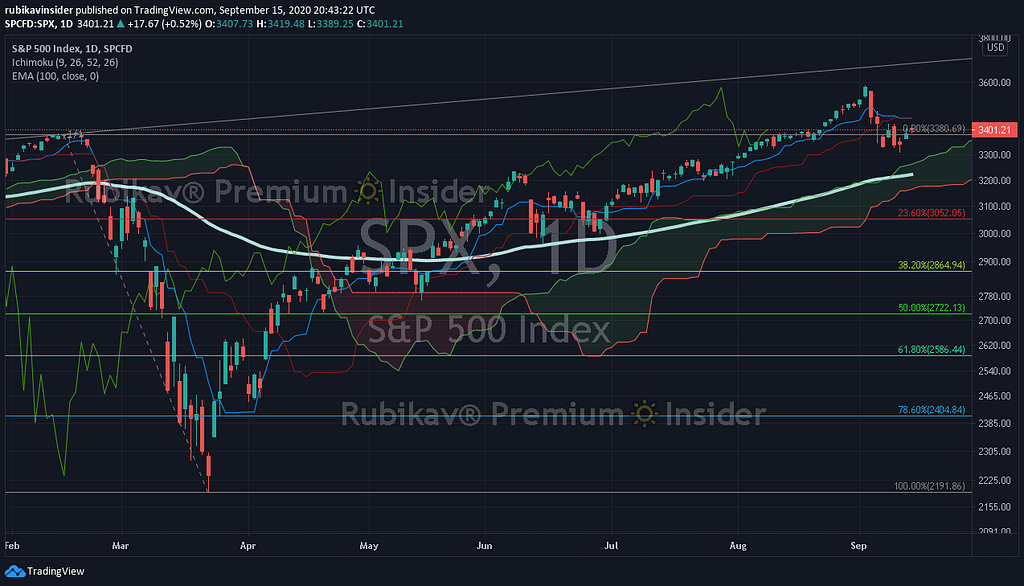
Bank of America Global Research analysts have noted that September tends to be the weakest month of the year; stocks have advanced less than half the time, and the S&P 500’s median return is less than 1%.
The bank’s data also indicates that markets tend to crash in the weeks leading up to an election, then skyrocket.
Resources
- https://es.investing.com/news/economy/economic-calendar--top-5-things-to-watch-this-week-2036255
- https://www.coindesk.com/crypto-volatility-misunderstood
- https://ecoinometrics.substack.com/p/ecoinometrics-september-14-2020
- https://insights.glassnode.com/the-week-on-chain-week-37-2020/
- https://cryptopotato.com/report-after-buying-bitcoins-bottom-in-march-whales-continue-accumulating/
- https://eng.ambcrypto.com/bitcoin-for-s2f-to-be-valid-in-2021-this-is-btcs-price-target-for-december/
See you in the next story! With love 💛 Rubikav® Team!
Let us know what you liked the most about this article in the comment box.
Follow us on Twitter, TradingView, Coinigy, Facebook, Uptrennd, Medium, Publish0x, Telegram Community, & Instagram.

Make the next generation of blockchain video game development with Enjin. Click on the banner and know more.
Don’t forget to use our referral code “rubikav” and enjoy the best experiences.

Crypto Wallets that we recommend to use: Coinbase, Exodus, Atomic Wallet, Enjin Wallet and Trust Wallet.
Crypto Exchanges that we use to trade: Binance, Binance Futures, Bybit, Derebit, Kucoin And Houbi Global With Cornix Auto Trade Bot.
https://twitter.com/thecapital_io
Financial Cryptocurrencies Markets Compilation Statistics News Up was originally published in The Capital on Medium, where people are continuing the conversation by highlighting and responding to this story.
from The Capital - Medium https://ift.tt/2Rvk6TX

0 Comments