
Check out our new platform: https://thecapital.io/
As bitcoin (BTC) becomes more accessible, conditions for the robustness and health of the Bitcoin network improve. This is one of the conclusions of the study Drivers of the value of Bitcoin, published last week by the Bitstamp exchange.
The report, which featured input from digital asset data provider for institutional investors, ByteTree, addresses the comparison between bitcoin and various asset categories, including stocks and gold. It also examines the risk characteristics of bitcoin and an alternative model to understand the value of that cryptocurrency.
External Media
ByteTree co-founder and chief investment officer, Charlie Morris, argues that the analysis of the price of an asset in the market does not only depend on its fundamental parameters, as external factors would also play a role.
Morris notes that “bitcoin likes easy money,” referring to central banks’ “quantitative easing” (QE) policies in response to the global health crisis. These policies include low-interest rates and important fiat money issues, such as the dollar or euro.
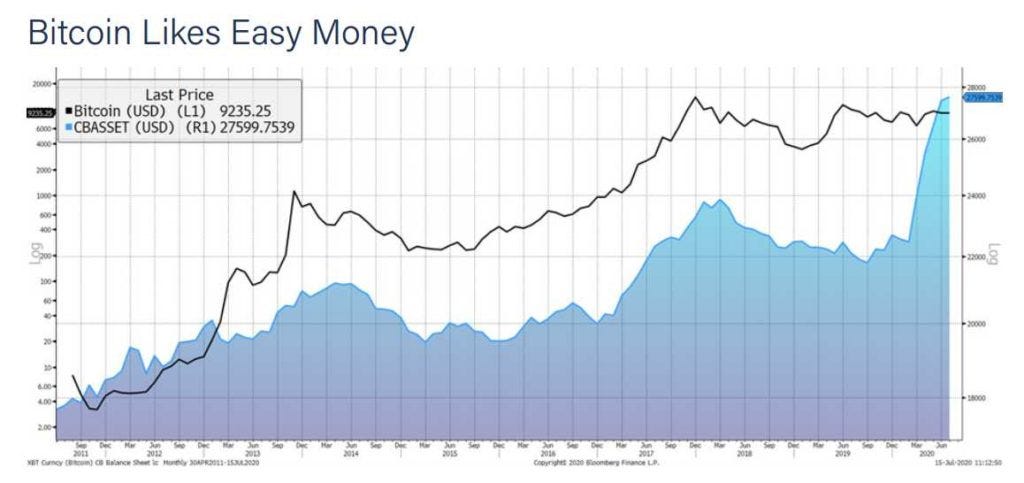
To summarize this relationship of bitcoin versus QE policies, Morris proposes the following graph, which contrasts the price of bitcoin with the joint balance sheet of four major central banks: the Federal Reserve (the FED) of the United States, the Bank of Japan, the European Central Bank, and the People’s Bank of China.
Between April and June of this year, the balance sheets of these four major central banks increased by more than $ 4 trillion, from approximately $ 22.5 trillion to $ 27.6 trillion.
For its part, Bitcoin, along with the rest of the markets, registered a significant fall on March 12, although it later experienced a moderate recovery. At the end of July, bitcoin experienced a major rally, staying above $ 10,000 since that date.
Great Interest
A new institutional investment decision, Square’s purchase of $50 million in bitcoin, took the price above $ 11,000 this week.
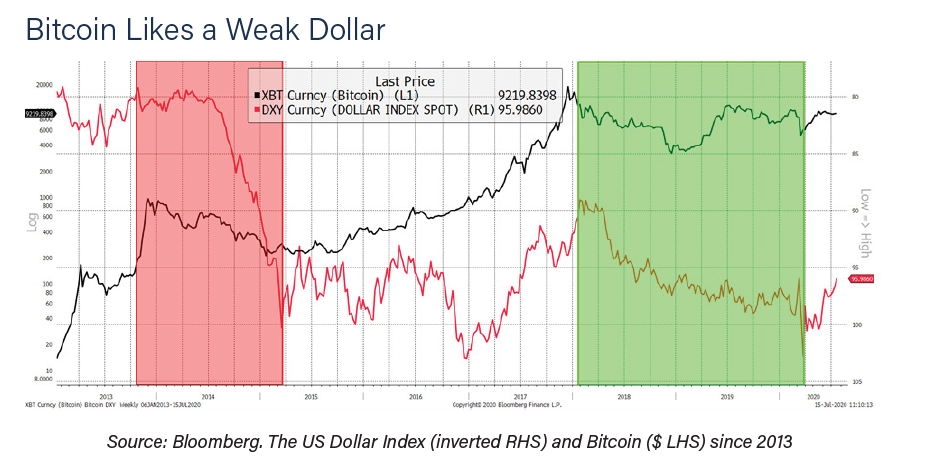
Regarding the relationship between bitcoin and the US dollar, the report indicates that the Fed’s monetary policies have weakened the dollar, but that the influence of this fall is not so decisive in the price of bitcoin.
If the dollar falls, the report says, it is logical that the price of an asset in dollars should rise, or vice versa. “But this obvious fact has a small impact because the movements of the Forex market are small compared to those of the bitcoin market.”
The average volatility of the USDX index, which reflects the strength of the dollar against a basket of rival currencies, from 2015 to the present, is 6%. The average volatility of bitcoin in the same period is 60%, says the study.
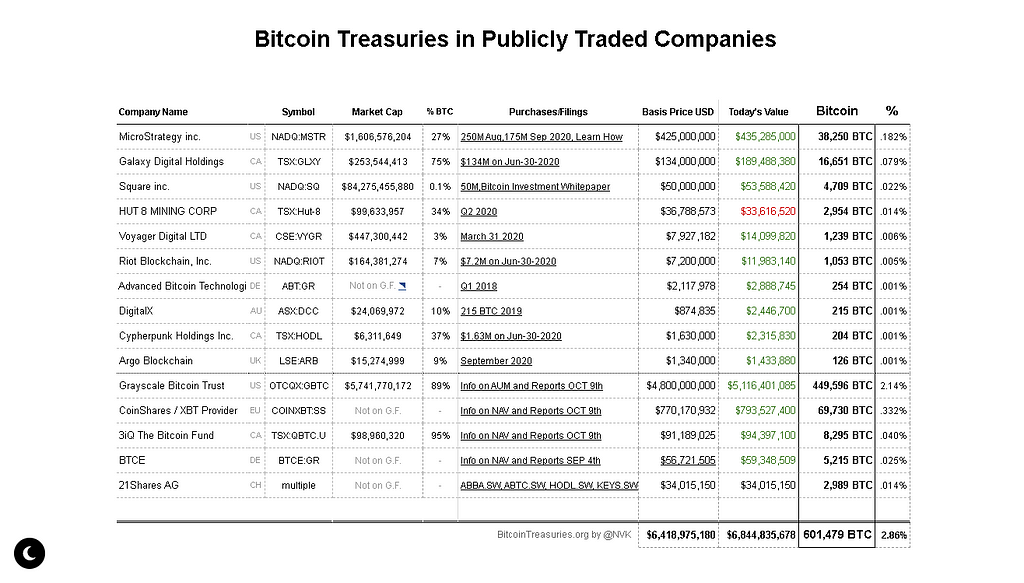
Actuality, nearly 600k Bitcoin is held by publicly traded companies, says another report, which identifies that for the last months, the institutions have kept great interest for assets in relation to others.
Risk Social Networks
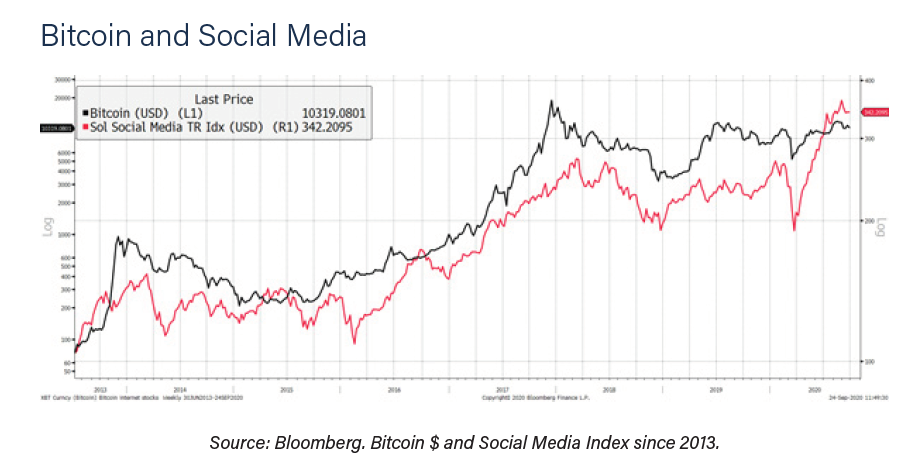
There are two aspects that the report highlights: the relationship between bitcoin and assets most associated with risk, on the one hand, and the relationship between cryptocurrency and assets directly linked to social networks, on the other.
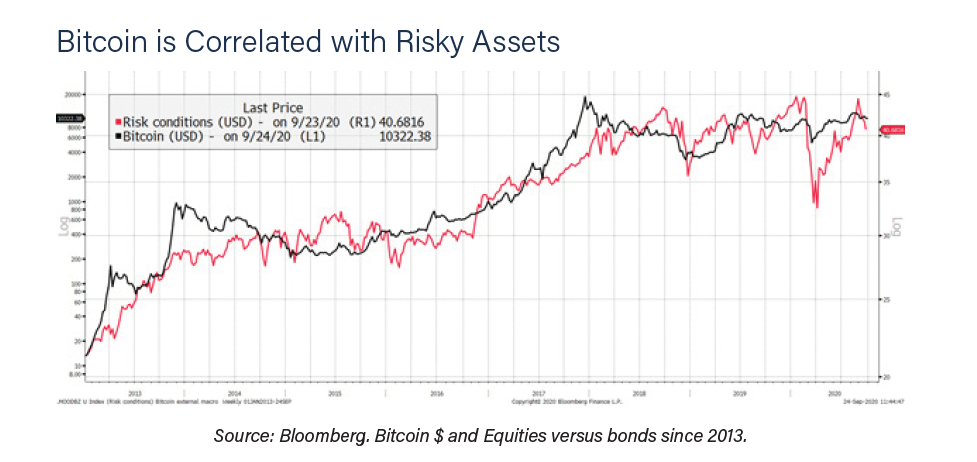
Regarding risk, the study authors chose the relationship between stocks and bonds as an indicator of risk conditions, since the latter is traditionally more stable (red line in the graph above).
The relationship between risk conditions and the price of bitcoin is imperfect, the authors say, but they also underscore that there is a growing correlation over time.
They highlight the bearish period of bitcoin at the end of 2018, where the risk conditions fell markedly along with the price of BTC, and the rise of both in the time after the fall of the markets in March of this year, as seen noted in the graph.
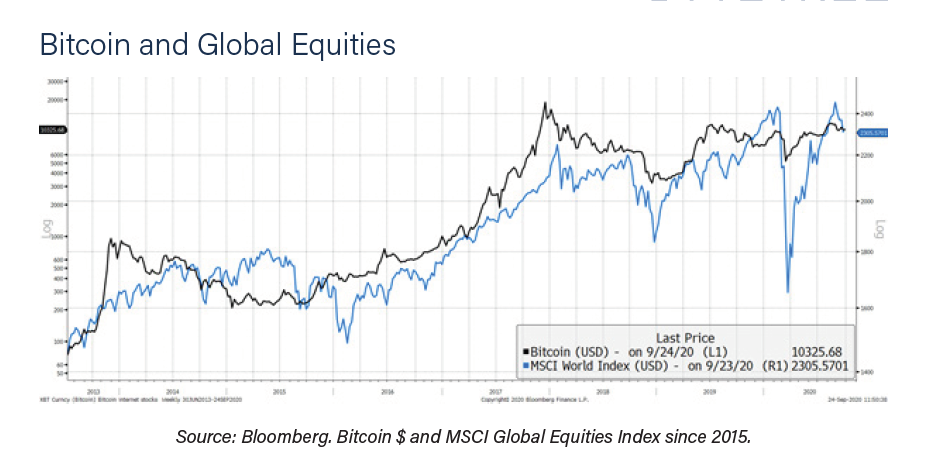
Looking at Bitcoin and global equities, the relationship has been strengthening. Of interest is the 2017 Bitcoin peak, which led the equity peak by 40 days. Thereafter, the match in Q4 2018 is evident, as is the COVID fall.
However, there have been periods of mismatch. Bitcoin drifted lower in H2 2019; perhaps it got ahead of itself following the H1 surge. And today. Once again, Bitcoin is lagging behind risk assets in general.
Inverse Relationship
The report says that gold and Bitcoin are different assets. The supply side of Bitcoin was designed around the idea of gold, such as: limited supply, fungibility, reliability, and so on.
That ought to mean gold and Bitcoin have something in common, but it turns out to be much less than you might think. As previously mentioned, Bitcoin enjoys easy monetary conditions, but in a
a different way to gold.
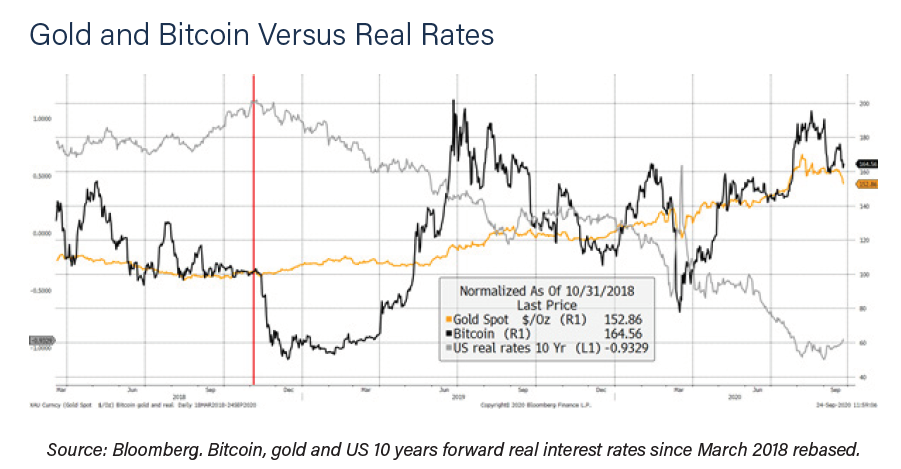
The chart was rebased to 100 at the peak in real rates on 31st October 2018. Coincidently, gold and Bitcoin have returned more or less the same return since, but via very different paths.
If you had invested in gold, you would have made 52% and 64% from investing in Bitcoin. However, if you had invested in both of them on a 50/50 basis, and rebalanced each month, you’d now have 93% (to end August 2020 ByteTree data).
Deflationary Moment
Another important idea he says is that in recent years, we have seen deflationary busts in 2008, 2015, 2018, and 2020. Under these scenarios, quality outperformed because these high-quality assets are resilient and offer certainty.
Companies such as Johnson and Johnson or Nestle still fell during periods of crisis, but much less than the market, and therefore outperformed. Similarly, US treasuries are highly desirable when the market collapses, whereas emerging market and corporate debt come under pressure.
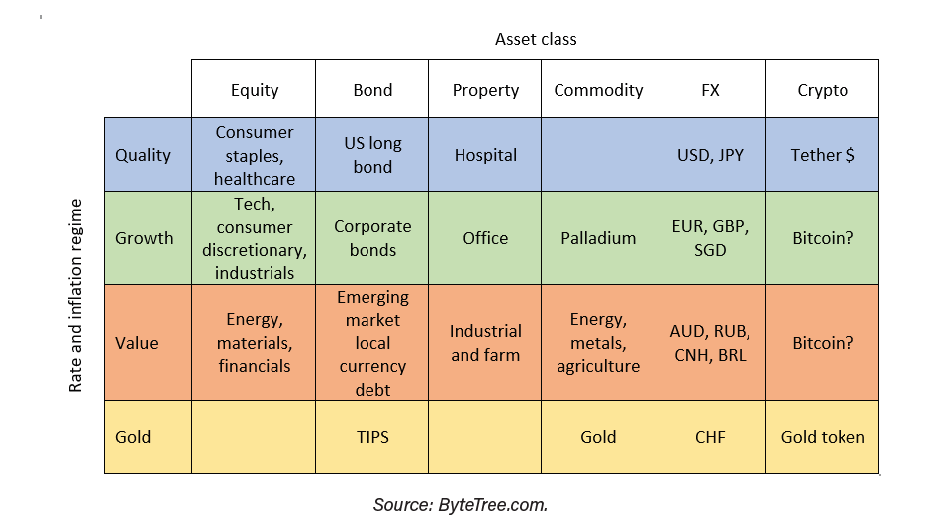
In property, healthcare REITs outperformed retail, industrial or office REITs. There was a flight to the US dollar and to the Japanese and in. During these periods, value performed poorly.
During the inflationary boom in 2011, gold surged along with the Swiss Franc, while corporate credit came under pressure. Although palladium is a precious metal, it fell by 18%, and tech stocks struggled. I could keep going, but the focus is on Bitcoin, to see how it responds to rates and inflation.
Macro Regime
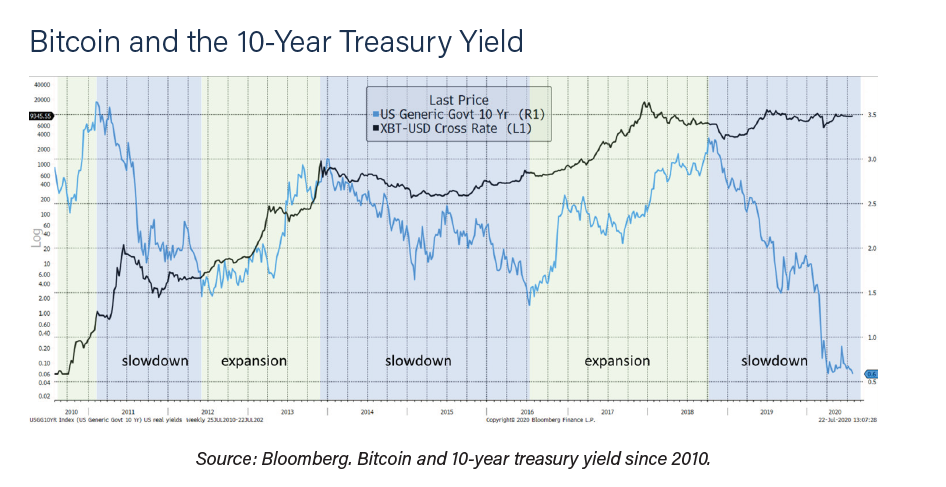
On the other hand, another thesis states that on the report says that leaving aside the early years, where it is unlikely that macro factors had much impact, Bitcoin has tended to do best alongside growth assets in 2013 and 2017. Then again, Bitcoin has done worst alongside growth assets in 2014 and 2018. With 2013 being a terrible year for gold, the evidence so far is that Bitcoin is a growth asset. But this evidence is only circumstantial, and we need to dig deeper.
In the first instance, they examine how Bitcoin has fared under rising and falling bond yields, which is an approximation for economic growth. The economy has done best when yields have risen and contracted when they have fallen. The bond yield isn’t the perfect Bitcoin trader, but it’s not bad at all. You can see from the naked eye that owning Bitcoin during periods of economic expansion (rising yield) has been better than when the economy was contracting.
The same holds true for inflation. Rising inflation, which reflects higher demand, has also coincided with some of Bitcoin’s best years. That said, it did miss the critical 2013 bull market but has been reasonably effective since.
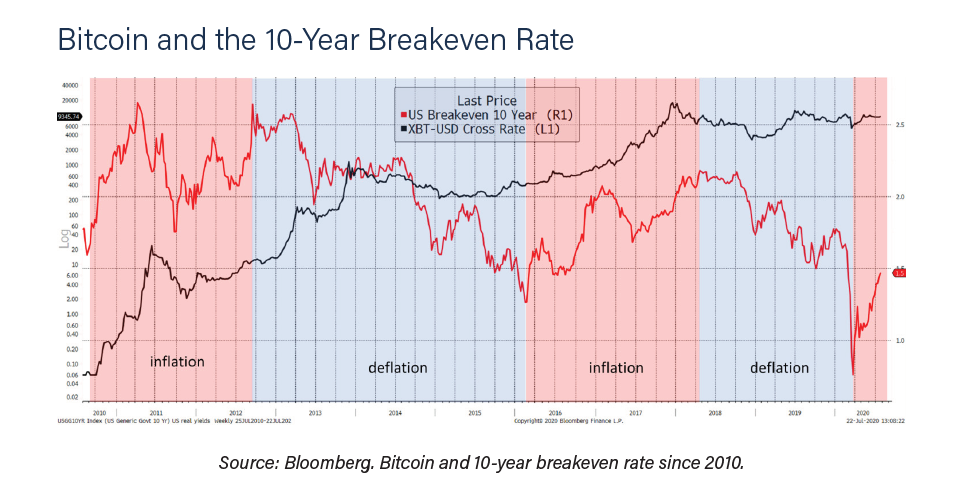
To finish off this point, they have run a simple test when you own Bitcoin under the stated conditions. They have used the gradient of the 40-week moving average to define whether rates or inflation are rising or falling. It is imperfect but objective.
Since the bond yield is always either rising or falling, one side will always be invested, and so the combined outcome of both conditions will equal buy and hold. The same is true for the inflation test. They have added the real yield (the bond yield less inflation), and the curve (the bond yield plus inflation).
Demand Indicators
Bitcoin is the first economy to be entirely based on the internet, the study notes. As such, its success is tied to the level of activity that occurs on the network. “This activity benefits from the size of the active user base and its operations. The more vibrant the network is, the greater the total value,” the authors note.
The number of transactions per year, for example, compared to the price of bitcoin, is a good indicator of the level of activity, the authors argue. The report highlights that 100 million transactions per year show that Bitcoin has become a substantial operation.
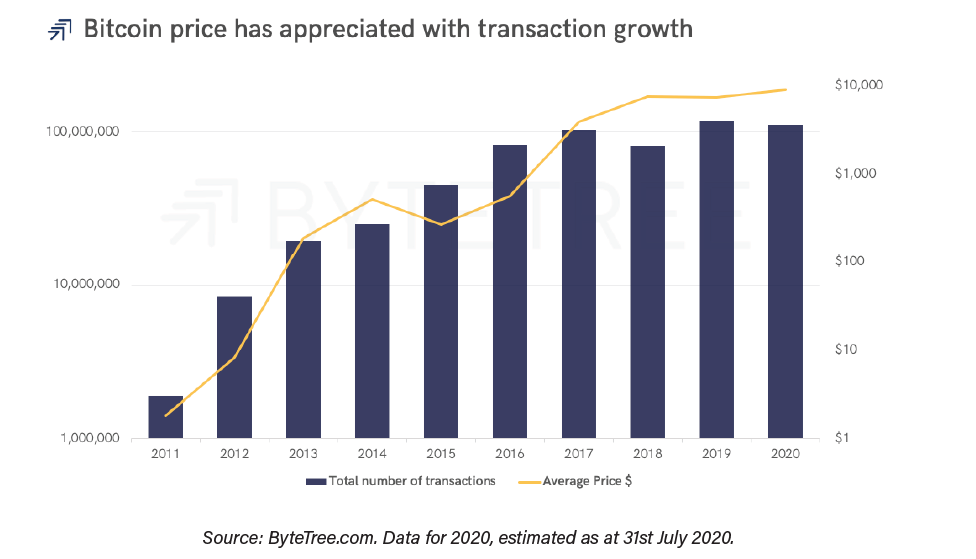
While the number of transactions can be affected by fees, and also become somewhat imprecise by batch transactions, the total value transferred in Bitcoin has continued to grow, the authors note.
As can be seen in the graph below, the milestone of USD 800,000 million exchanged annually on the network has already been surpassed.
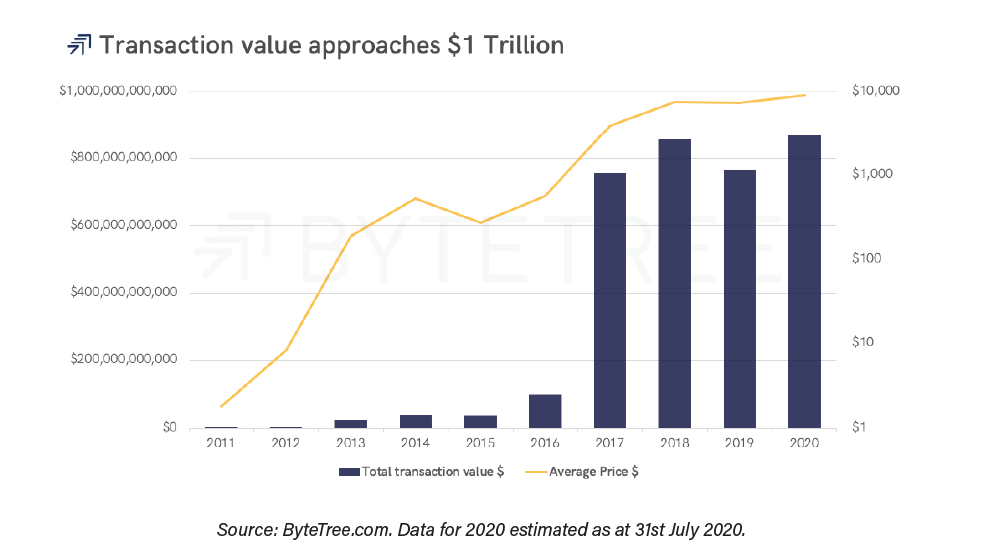
By 2020, ByteTree estimates that the total transferred value in Bitcoin will be USD 853,000 million, a value higher than that achieved in 2017, even though the all-time price high was reached that year. The reason for this higher performance in 2020 is the average price of BTC. In 2017, that average reached $ 7,519, while so far in 2020, the average price of BTC is the record value of $ 8,542.
ByteTree concludes that the relationship between the price of bitcoin and the total value transferred on the network is the most stable economic relationship.
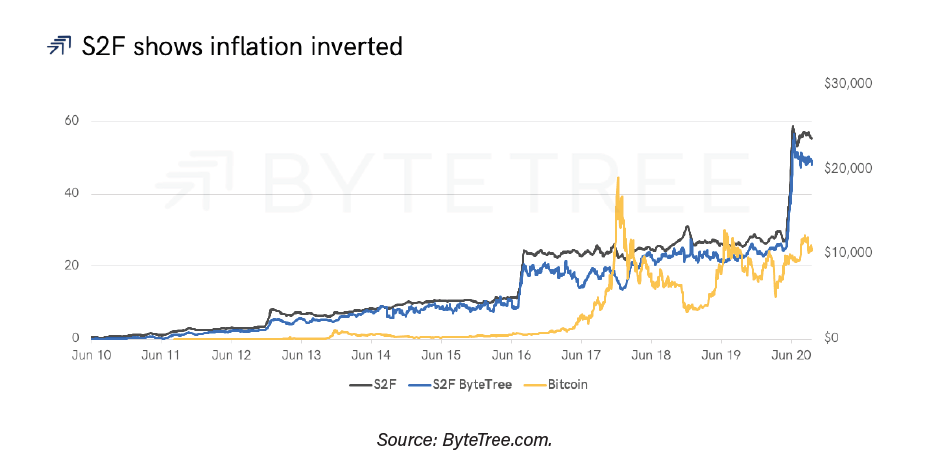
Model Failures
The S2F model is based on the idea that the scarcity of an asset helps its appreciation. However, ByteTree claims that the price of bitcoin is driven by demand and not supply.
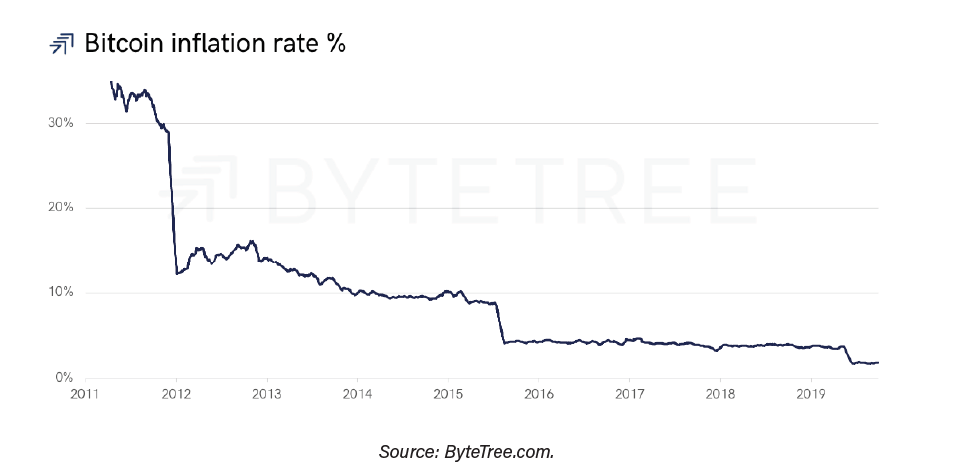
To demonstrate its hypothesis, ByteTree uses an S2F model, which it calls S2F ByteTree, which takes into account coins distributed by miners (first expense) as opposed to mined ones. The following graph shows the S2F (blue) and the S2F ByteTree (black), contrasted with the price of bitcoin (gold).
The rallies after the first two halvings were 5,428% (first halving) and 1,351% (second halving), says ByteTree.
When you look at 2012, 2016, and 2020, bitcoin has reached premiums of 100%, 150%, and 200% compared to a value that is considered fair, notes ByteTree. Bitcoin has also been 40% and 50% below that value, but according to the report it always returns to the so-called fair value. “This occurs because fair value is a fundamental value that attempts to calculate the intrinsic value of bitcoin,” says the report.
Fluctuations come in different shapes and sizes, for different reasons, and at different times. “A growing network, institutional capital flows, or an improved crypto structure can drive prices up in the same way that scandals, bubbles, and regulatory pressures can drive prices down,” the authors argue.
Under Conclusions
The study concludes that S2F does not attempt to calculate the intrinsic value of bitcoin. “It simply associates a reduction in supply with a rising price,” the study notes.
One of the implications of the S2F model is that miners produce fewer coins after each halving. The report acknowledges that there are indeed fewer coins to buy from miners, but argues that miners are not the only bitcoin bidders. “Anyone who owns BTC is free to sell.”
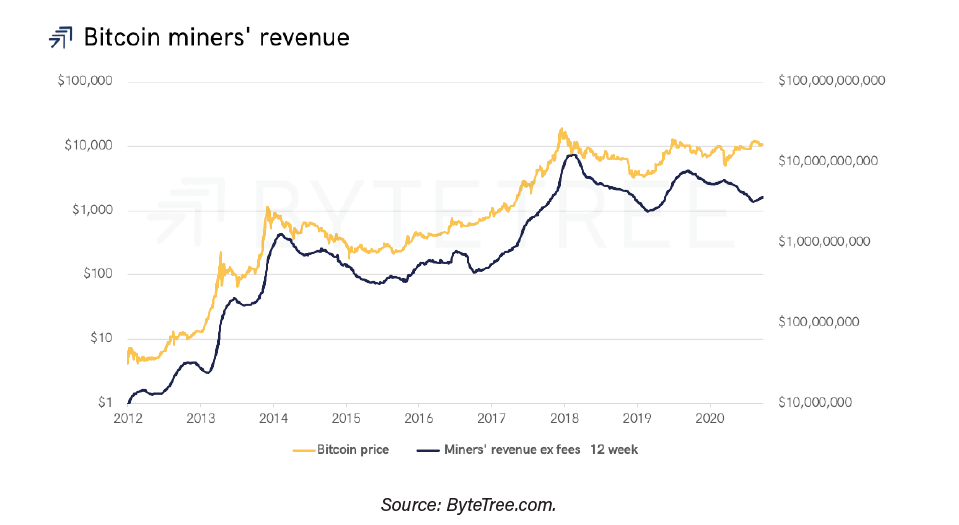
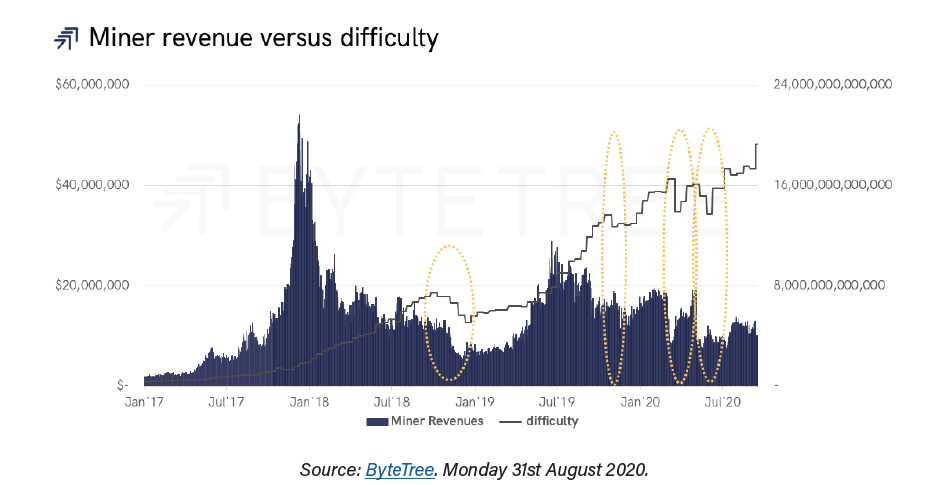
Another important argument of the report is that effectively, the flow becomes smaller, but also, the influence of the miners decreases as their income is less and less relevant compared to the market capitalization. The same happens with the percentage of income with respect to the total value of transactions, as shown in the following graph.
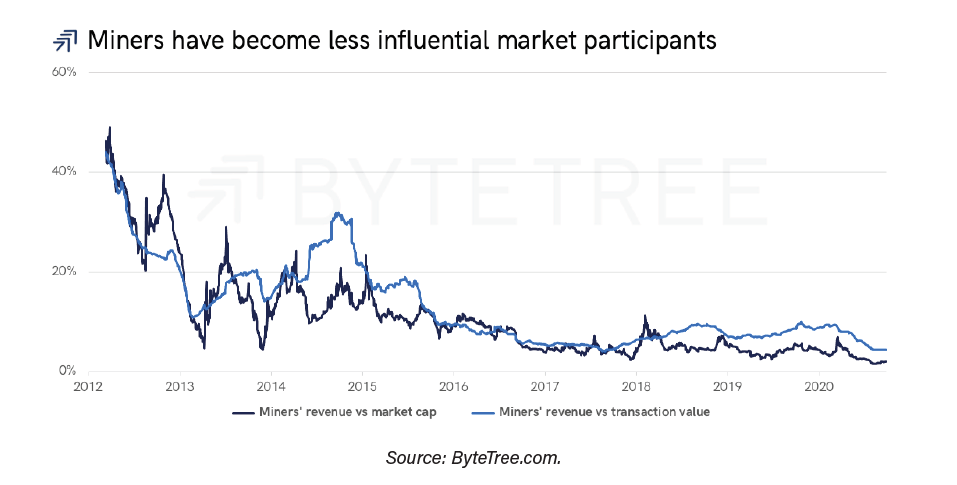
In 2012, miners’ income accounted for half of bitcoin’s capitalization and 68% of the total value of transactions. “At that time, they had a great influence on the price,” say the authors.
Those proportions, as clearly seen in the graph above, have declined to a single percentage digit in 2020: miners’ revenue today represents 1.7% of Bitcoin’s capitalization and 3.9% of transactional volume.
“The S2F thesis sees miners as the dominant price driving force, something that cannot be true when your influence is fading. There are many reasons why the price of bitcoin can go up or down, but S2F is not one of them,“ says the study.
Rotating Inventory
Among the drivers of the price of bitcoin related to the activity of miners, the report highlights the so-called Rotating Inventory of Miners (MRI). Bitstamp measures this index every six weeks, accounting for both BTC mined and BTC spent. The mined and unspent BTC become part of the miners’ inventory.
Every six weeks, ByteTree calculates the MRI, which reflects how inventory varies. Coins mined and coins spent during the period are counted. An MRI of 100% would indicate that all the coins mined by the miners were spent and that the inventory was unchanged.
An MRI of 60%, for example, indicates that of all the coins mined, 40% went to add to inventory. In contrast, an IRM of 110% implies that all of them were spent and an additional 10% were spent, taken from inventory.
A widely held belief, the report says, is that a high MRI (heavy miners selling) should be associated with downward price pressure. Similarly, a low MRI would be positive for the bitcoin price, as miners are holding onto mined BTC. “Certainly, the S2F model is going to share these theses, but ByteTree does not,” says the report.
“If demand is low, there is a weak market to sell to,” the study says. As a result, miners will wait for demand to improve, and that will allow their inventory to grow, the authors note.
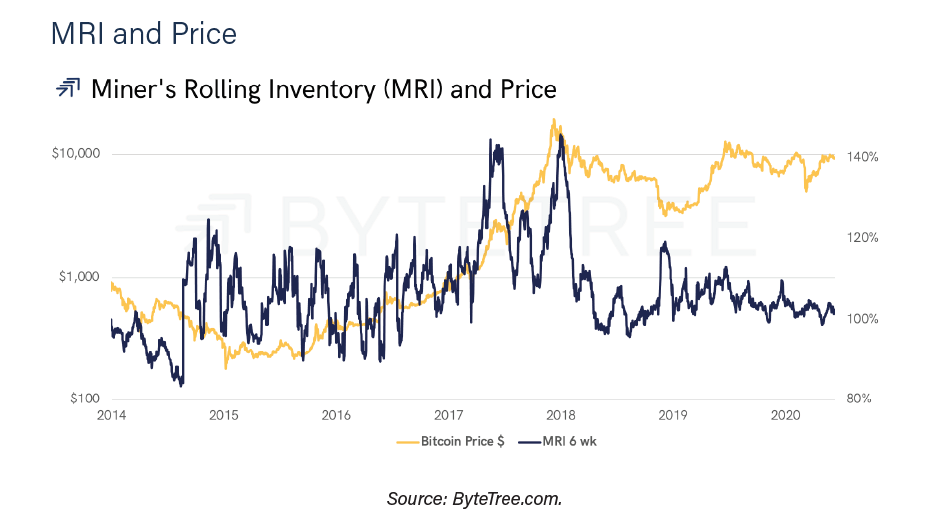
Regarding investors, the report points out that investing when the MRI is greater than 100% (and gives us an example that a limit could be set at 106%) is preferable than doing it when the MRI is less than 100%. “It is a defensive strategy that has avoided the worst of the bear markets, yet it tells the investor when to be present in the market.”
Most Important
The report, among its conclusions, highlights that one of the causes of the increase in the price of bitcoin is the Network Effect, but that as the asset matures, external influences may gain more importance.
“The dollar, the Fed, the appreciation of bonds and inflation all seem to influence the price,” the report said.
The value of Bitcoin is proportional to the size of the network, the author’s highlight, stating that as use cases and applications grow, the depth of the market will strengthen, the network will grow, and the price will rise.
See you in the next story! With love 💛 Rubikav® Team!
Let us know what you liked the most about this article in the comment box.
Follow us on Twitter, TradingView, Coinigy, Facebook, Uptrennd, Medium, Publish0x, Telegram Community, & Instagram.
Make the next generation of blockchain video game development with Enjin. Click on the banner and know more.
Don’t forget to use or referral code “rubikav” and enjoy the best experiences.
Crypto Wallets that we recommend to use: Coinbase, Exodus, Atomic Wallet, Enjin Wallet and Trust Wallet.
Crypto Exchanges that we use to trade: Binance, Buda, Binance Futures, Bybit, Derebit, Kucoin And Houbi Global With Cornix Auto Trade Bot.
https://twitter.com/thecapital_io
Current Factors Driving Bitcoin Value According To Bitstamp was originally published in The Capital on Medium, where people are continuing the conversation by highlighting and responding to this story.
from The Capital - Medium https://ift.tt/3jWMxqz


0 Comments