Check out our new platform 🚀 https://thecapital.io/
Hi everyone,
Bitcoin charged passed the $13,000 level as PayPal announced full support for various cryptocurrencies to its 350 million-plus users in the first quarter of 2021.
The news caused a major sentiment shift among traders and investors in the space, which has been indicative of trend turning points in the past.
As greed grips the crypto markets, what does the technical data tells us?
Let’s dig in.
Social Sentiment pulls a big 180 as bitcoin surges to $13,000
Analytics from santiment ‘crypto twitter’ has pulled the biggest u-turn in its decade-long history, shifting from negative to euphoric in a few days.
1) After #Bitcoin surged from $10.5k to $13.1k over the past three weeks, the social sentiment of #crypto #Twitter has done one of the biggest 180 turns in its decade-long history. The ratio of positive vs. negative commentary (combined with total volume of social posts) was at pic.twitter.com/fJi0Abldf1
- Santiment (@santimentfeed) October 26, 2020
The analytics firm added that all-time negative levels occurred on October 3rd, which was reflected by a major uptick in bitcoin shorts (i.e. traders betting against bitcoin).
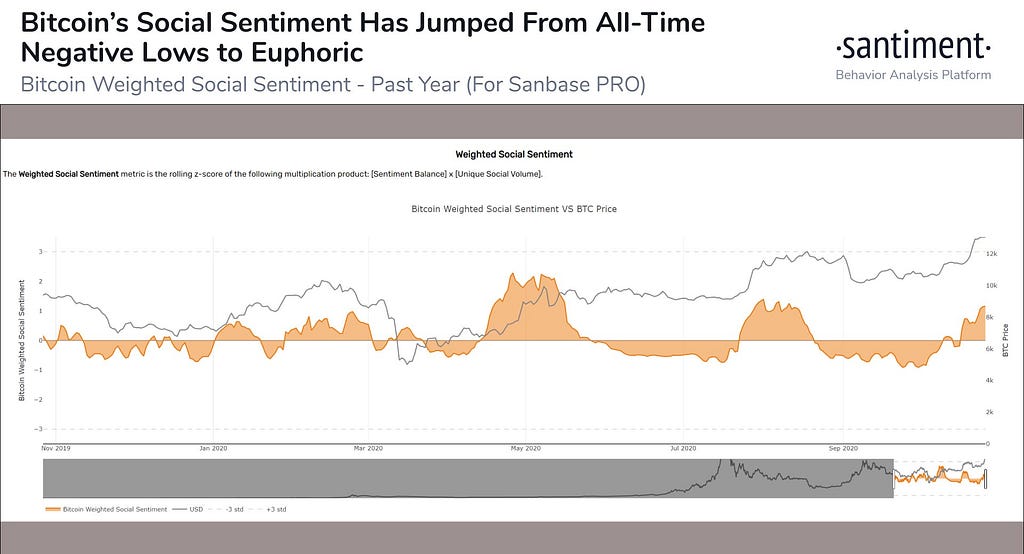
The chart measures bitcoin weighted social sentiment and was in negative territory for the month of October, more so than during the dip that followed the corona-crash in mid-March.
Analyzing the metric in late September, Saniment pointed out a trend it noticed in its analysis:
“Prices of BTC and other crypto assets tend to bounce most precipitously when the crowd is demonstrating a high level of FUD. This is exactly what we’ve been seeing for Bitcoin, Ethereum, and many altcoins following the early September retrace.”
That bounce occurred on October 21 when bitcoin surpassed $12,000 for the first time in almost two months and surged to a new 2020 high of $13,350 five days later.
Other sentiment indicators have also seen this major shift. In fact, the fear and greed index has pivoted into greed territory, standing at 75.
All in all, sentiment indicators are suggesting a cool-off period is likely when seen in their historical context. And with US elections just around the corner, the prospect of more volatility remains high.
Technically Speaking
Bitcoin reached the technical target of $13,000 plus, tapping $13,400 on various spot and derivatives exchanges during the run-up. As previously covered, there is no run-up without a correction, and remaining cognizant of pullbacks is paramount.
Weekly HTF closes on a strong note
There’s no other way of putting it: bitcoin’s weekly chart looks phenomenal, printing a 15% move that took the king crypto above $13,000 into one of the last remaining resistance areas between $13,400 and $14,000.
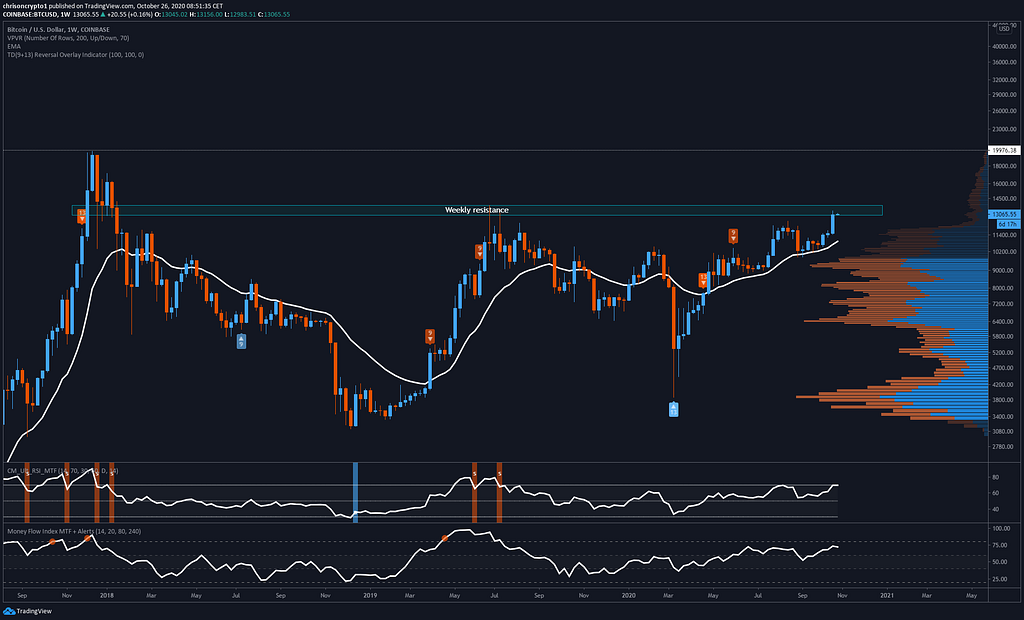
In fact, barely any exchange volume is present at these levels since bitcoin hasn’t spent more than a few weeks at these prices in its entire history.
The Relative Strength Index (RSI), is also teetering on overbought levels. However, in bull markets, it’s normal for the weekly bitcoin RSI to fluctuate in this overbought region (between 70 and 80) for weeks on end before cooling off to the mean.
If bitcoin continues this trend during the last week of October, that would set a precedent for major continuation in November or December after a pullback.
Daily & 12-hour suggest increased risk for bulls
As always, it’s not all infinitely green, and pullbacks are entirely normal in every market. In fact, Bitcoin’s daily technical picture suggests that a pullback to $12,500 (approximately) is entirely possible.
A TD-9 sequential top signal has flashed and while there is still room from upside, the bullish picture isn’t as clear as it was prior to the $12,000 pump.
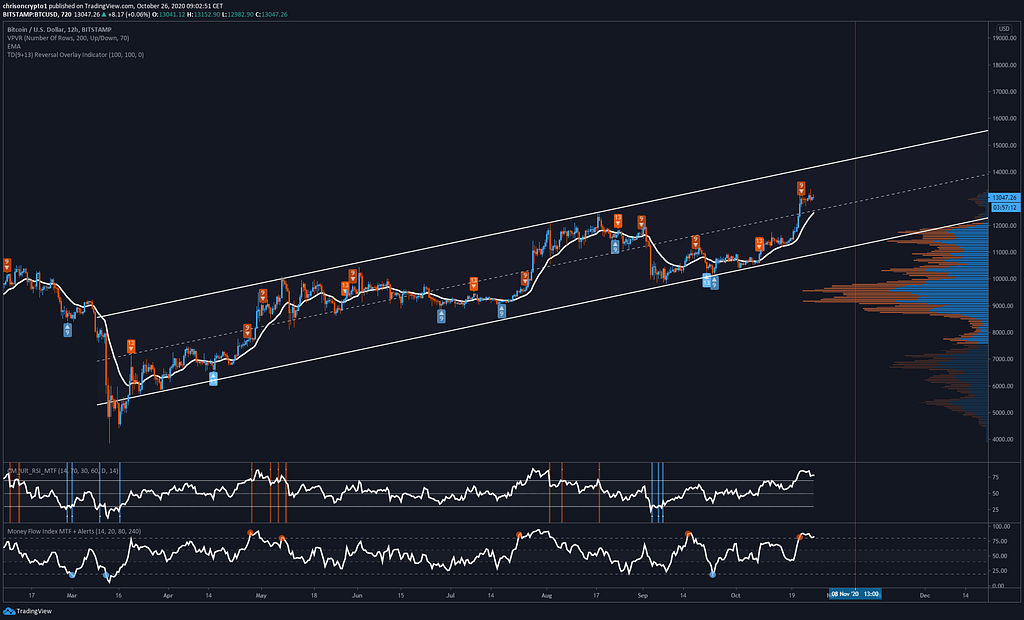
Bitcoin’s 12-hour chart paints a better picture, and suggests a prospective buy opportunity should bitcoin retrace to the mid-line of its upwards channel (at $12,500).
Bear in mind that this channel is not in logarithmic format (per the last newsletter). Broadly, the differences shouldn’t be major between graphs and a spike into $14,000 wouldn’t nullify either chart.
All in all, bitcoin is technically ready to cool off before grinding towards all time highs. As always, it’s possible for the king crypto to shoot for the last hurrah to $14,000; an external catalyst could spur fresh impetus to this mid-term technical level.
Levels to watch:
- $13,400 resistance suggests an impulse move to $14,000
- $13,000 support failure suggests a retracement to the mid $12,000 area.
Onward bitcoin Spartans.
Catch you next time.
Share this content on your socials. Appreciate your support!
Join theTelegram channel for live updates!
Follow me onTwitter & Instagram for more lighthearted content.
Referrals, business opportunities and feedback are also appreciated.
Read More: JP Morgan: Bitcoin has ‘considerable’ upside compared to gold

Are you a frequent reader? Tip me! Send
BTC to this address:
3EydsEYpjHn68axKnCUqBB7EbqcxrEjamr

Best regards,
Christopher Attard
Founder of Chris on Crypto
Contributor to www.cityam.com
Connect directly on: Telegram
Originally published at https://mailchi.mp.
https://twitter.com/thecapital_io
In Context: Bitcoin Sentiment Metrics Predict Trend Reversals? was originally published in The Capital on Medium, where people are continuing the conversation by highlighting and responding to this story.
from The Capital - Medium https://ift.tt/3mjNVEm


0 Comments