For those who prefer watching instead of reading:
Given the nature and complexity of the topic, I recommend continuing to read this article rather than watching the video to gain a better understanding of the matter.
Please note that the video and article are identical, but this text is slightly more up-to-date and includes additional charts.
Why Global Liquidity Matters for Bitcoin
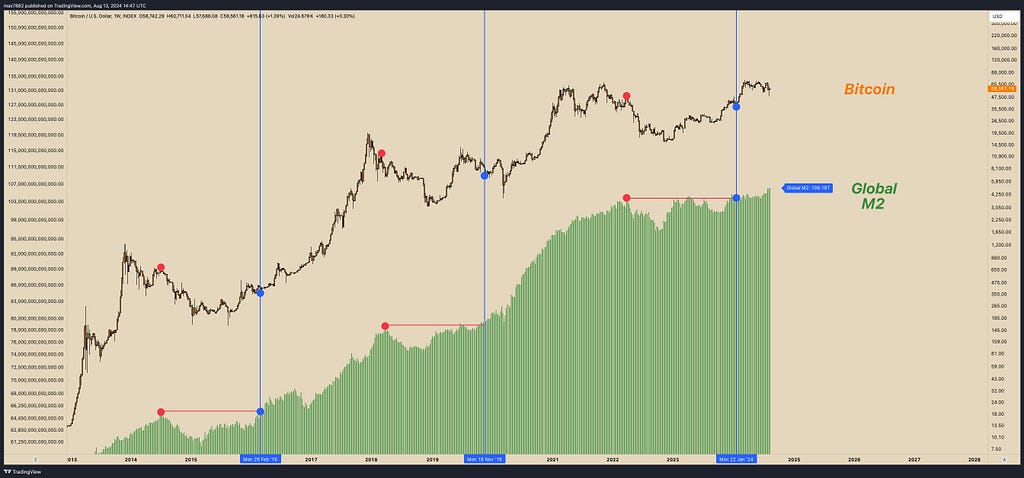
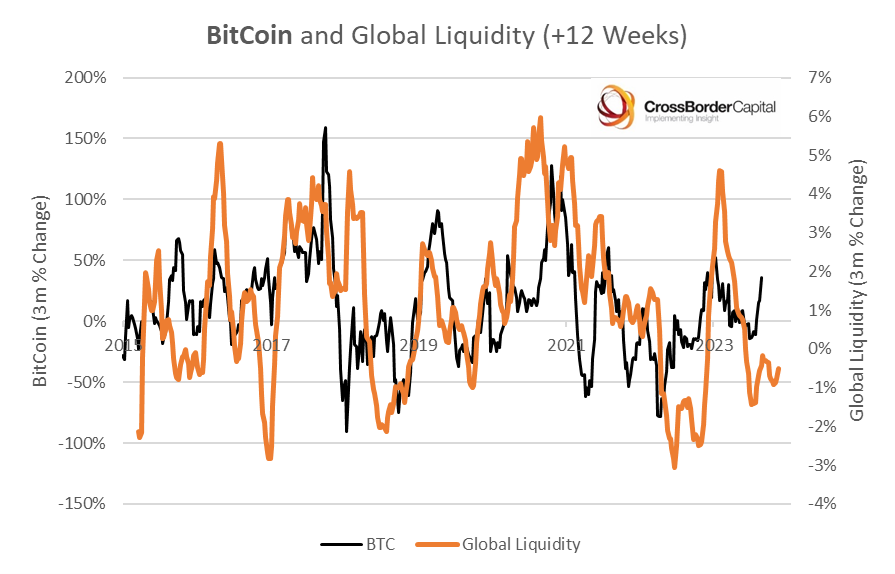
Since Bitcoin acts as a monetary hedge (/solution), global liquidity is currently one of the most important factors driving Bitcoin’s price. As you can see, there’s a very strong correlation between global liquidity and Bitcoin’s price history.
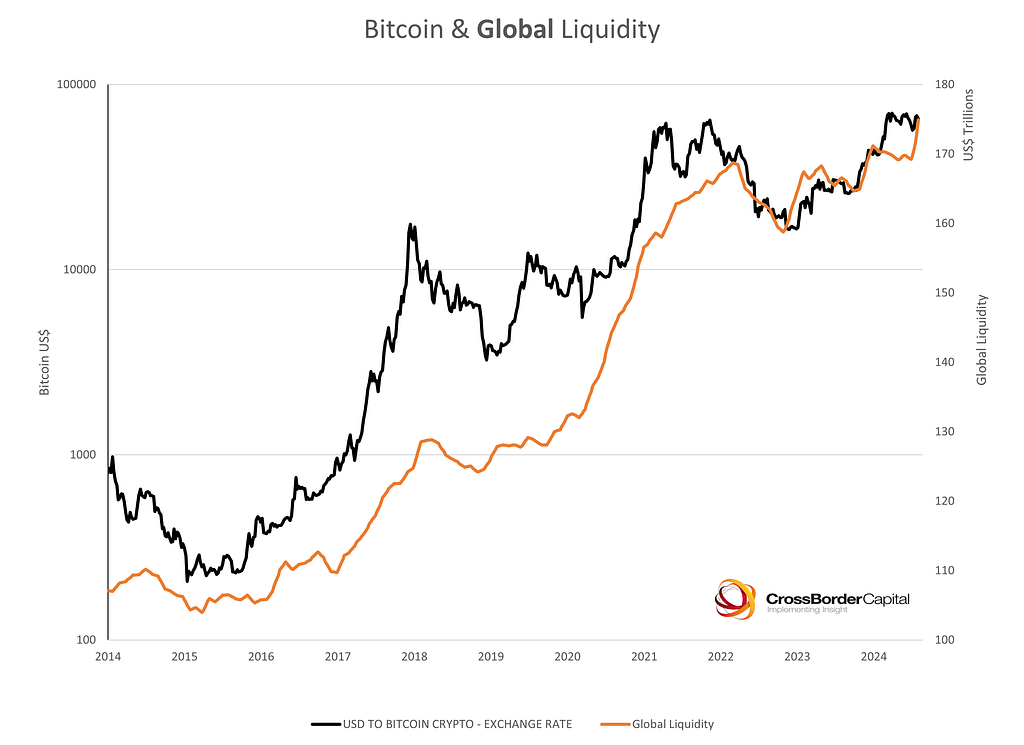
Simply put, when global liquidity increases, it’s good for Bitcoin; when it decreases, it’s bad. For example, last quarter, global liquidity was decreasing, which put downward pressure on Bitcoin.
Understanding Global Liquidity
The Global Liquidity Index measures the credit capacity of credit providers and how much money is available for spending and investment worldwide. It indicates how easy it is to buy, invest, or get loans. This index is primarily measured by the global M2 money supply, which represents the total amount of currency and near money in a country’s economy. Global liquidity can increase due to central bank policies. For example, in the U.S., they can drain the Reverse Repo balance, drain the Treasury General Account, issue bills, bailouts, buy government securities, but most importantly, lower interest rates or implement quantitative easing (QE). For those unfamiliar with the term, QE is essentially the Fed printing money and buying government bonds.
Bitcoin & Global Liquidity’s Correlation
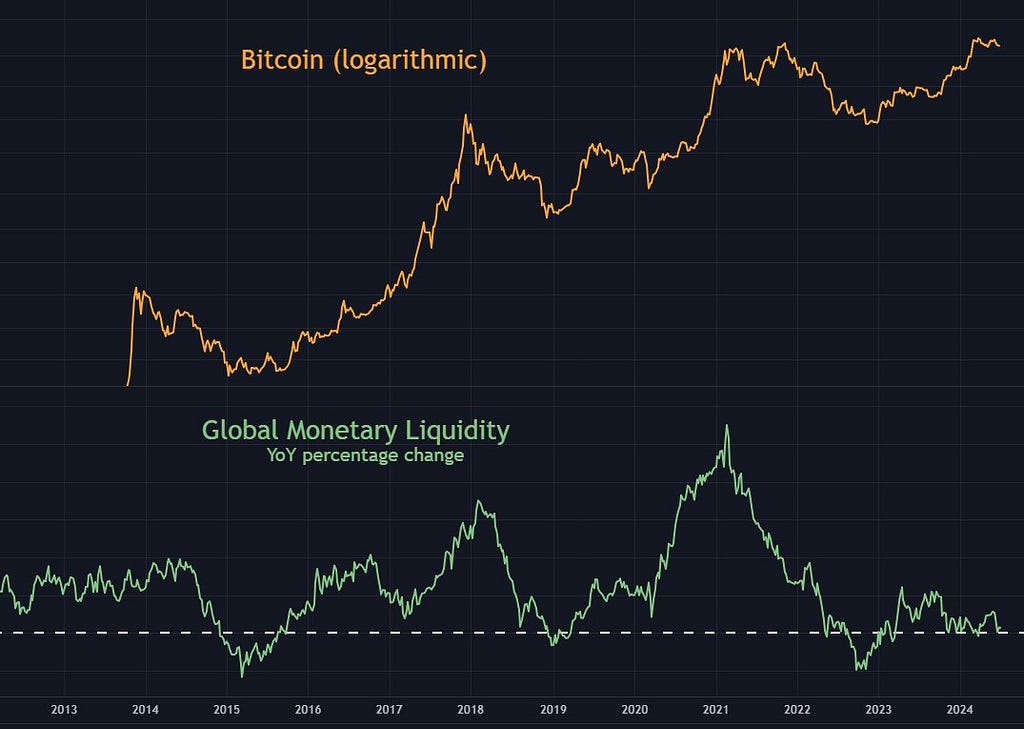
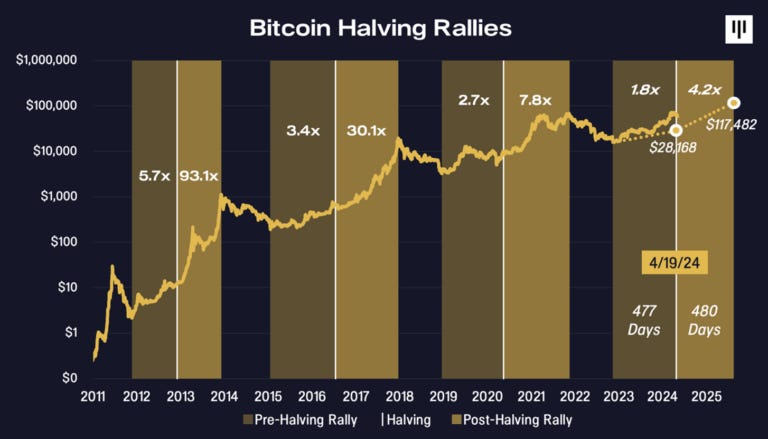
So, why is all this important? Well, throughout Bitcoin’s history, we notice that Bitcoin and global liquidity move in lockstep with each other. More money in the global system encourages spending on ‘risk assets’ such as Bitcoin. Therefore, historically, Bitcoin bull markets have coincided with the rapid expansion of global liquidity.
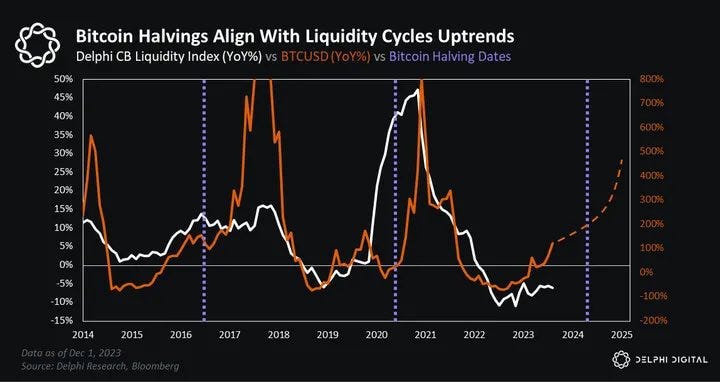
And not necessarily due to the Bitcoin block reward halving as many might think. The macro liquidity cycle just happens to align with previous halving cycles.
Three Key Drivers of Global Liquidity
To assess whether global liquidity is contracting or expanding, you need to look at three main factors: (1) U.S. Fed Liquidity; (2) PBoC Liquidity; and (3) bond volatility.
Bond Volatility
Bond volatility is measured by the MOVE index, which governs the efficacy of the collateral pool that determines future private sector credit provision. This index gives us an idea of how effectively collateral is being used within the system. The MOVE index of bond market volatility has been trending lower, but the data also shows that current levels of volatility sit uncomfortably above traditional norms of around 70 on the index.
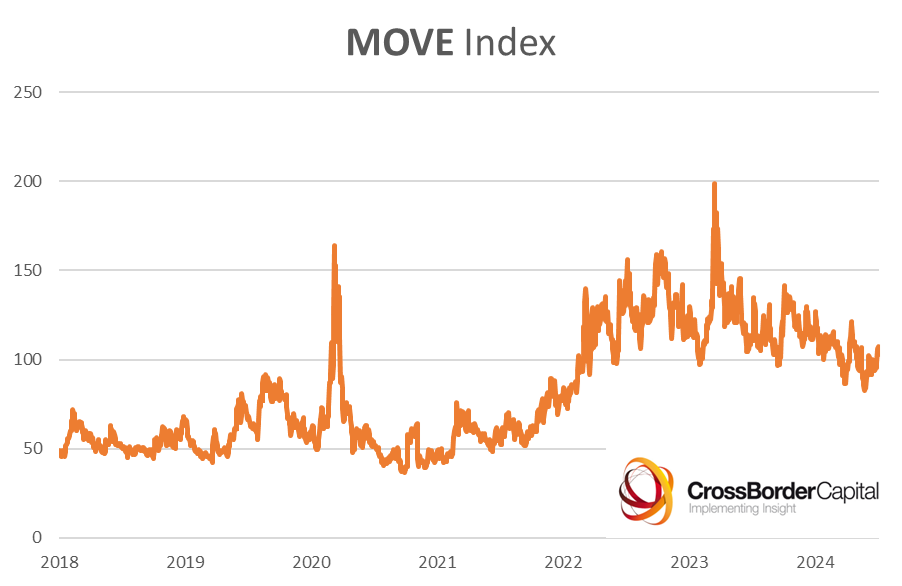
When the MOVE index trends lower, it indicates a decrease in bond market volatility, leading to increased efficiency in the collateral pool. This, in turn, can contribute to increased global liquidity as private sector credit provision becomes more effective.
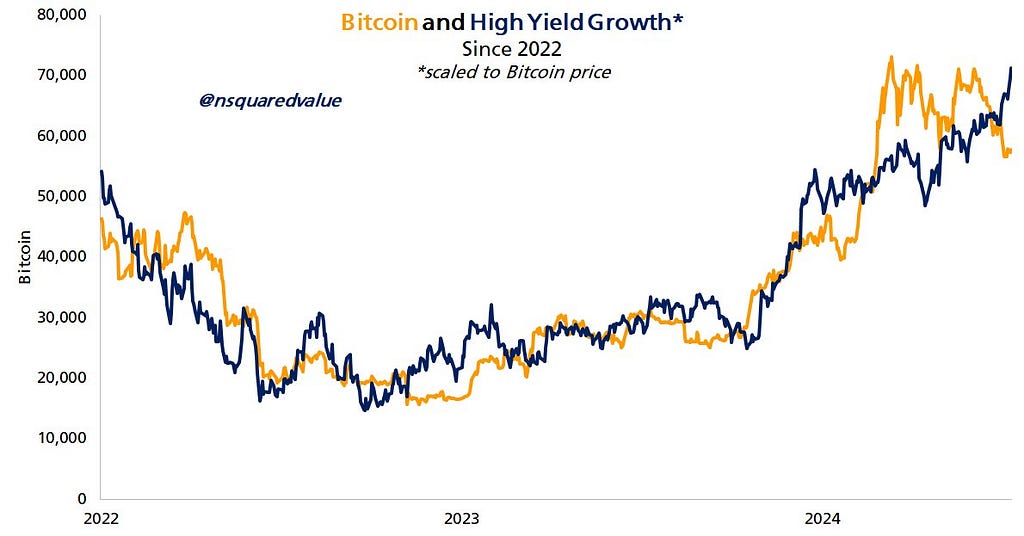
Bitcoin and High-Yield Bonds Correlation
Speaking of bonds, as high-yield (HY) corporate bond rates rise, so does Bitcoin. This pattern implies that increasing risk appetites in the bond market, signaled by rising HY rates, could drive more investments into riskier assets like Bitcoin. The chart’s exponential trend line reinforces this causal relationship.
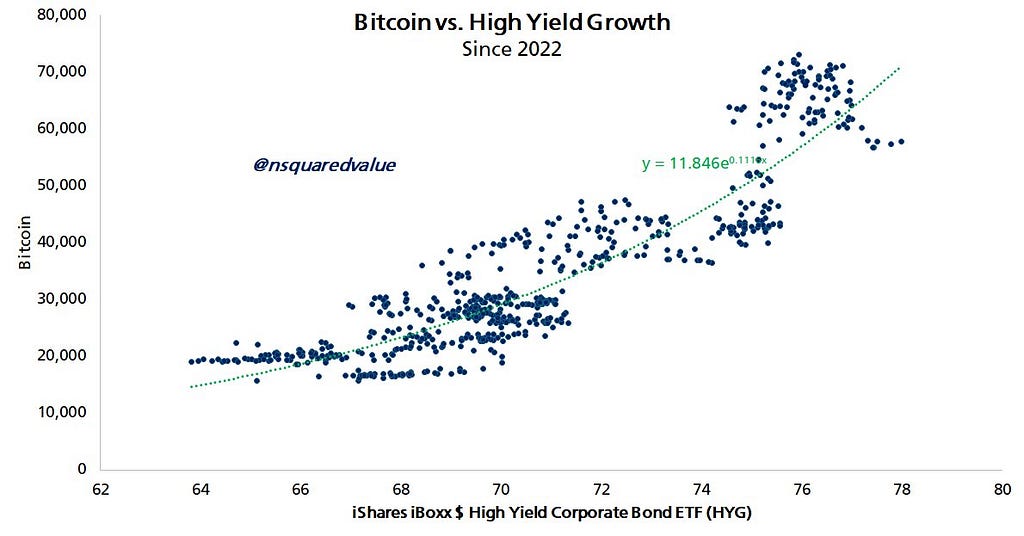
According to this metric, one Bitcoin should be worth about $71,000.
The U.S. Federal Reserve
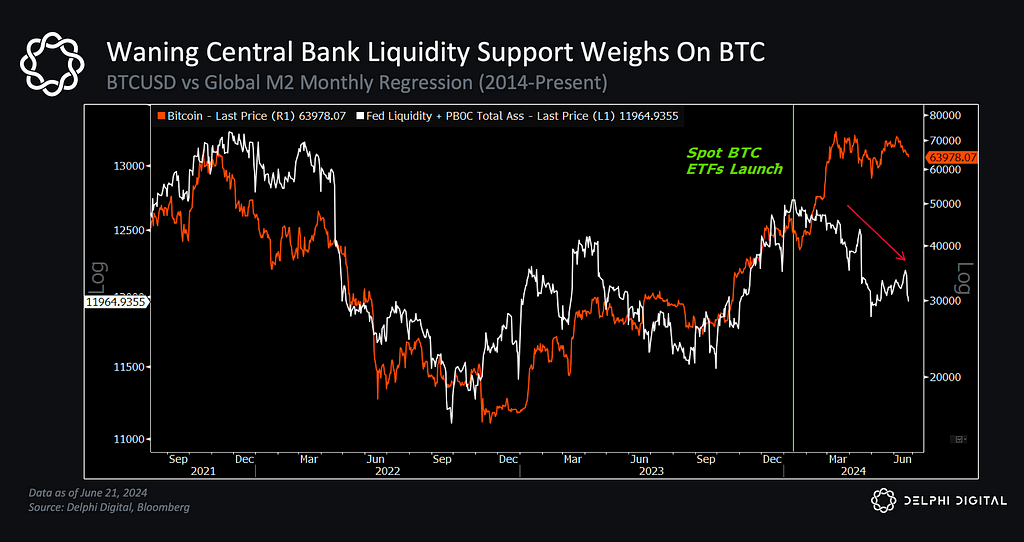
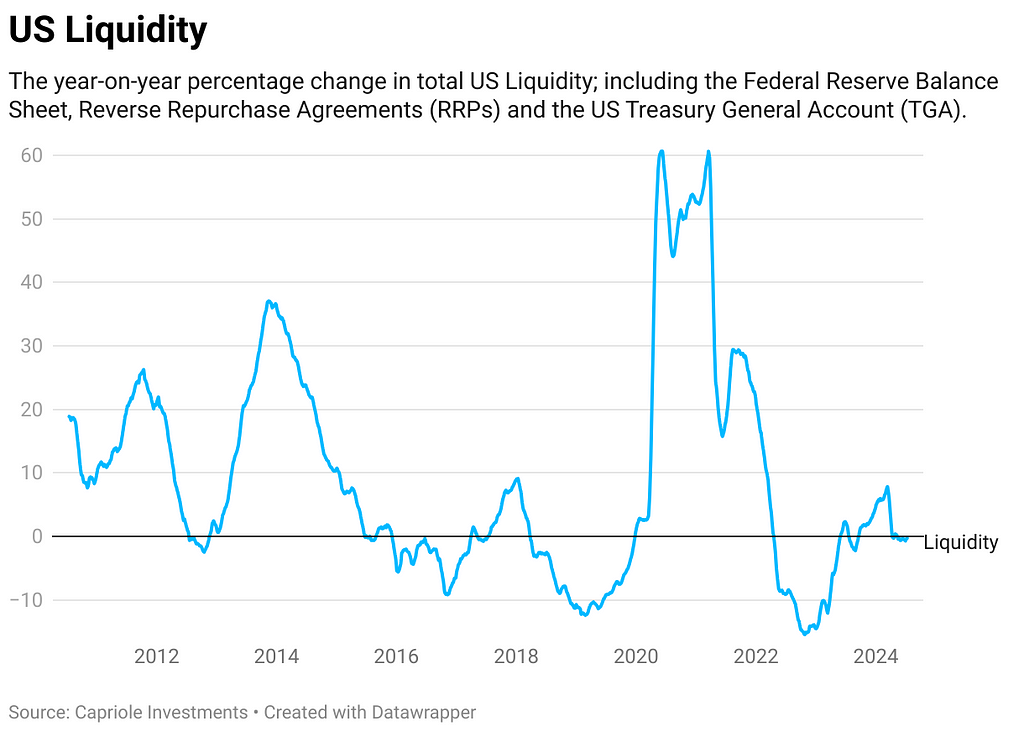
Fed liquidity affects money market liquidity and the level of banks’ reserves. Since the 2008/09 global financial crisis, this has been the single most important driver of global liquidity.
The U.S. Fed has not helped domestic liquidity conditions since the mid-April surge of tax inflows.
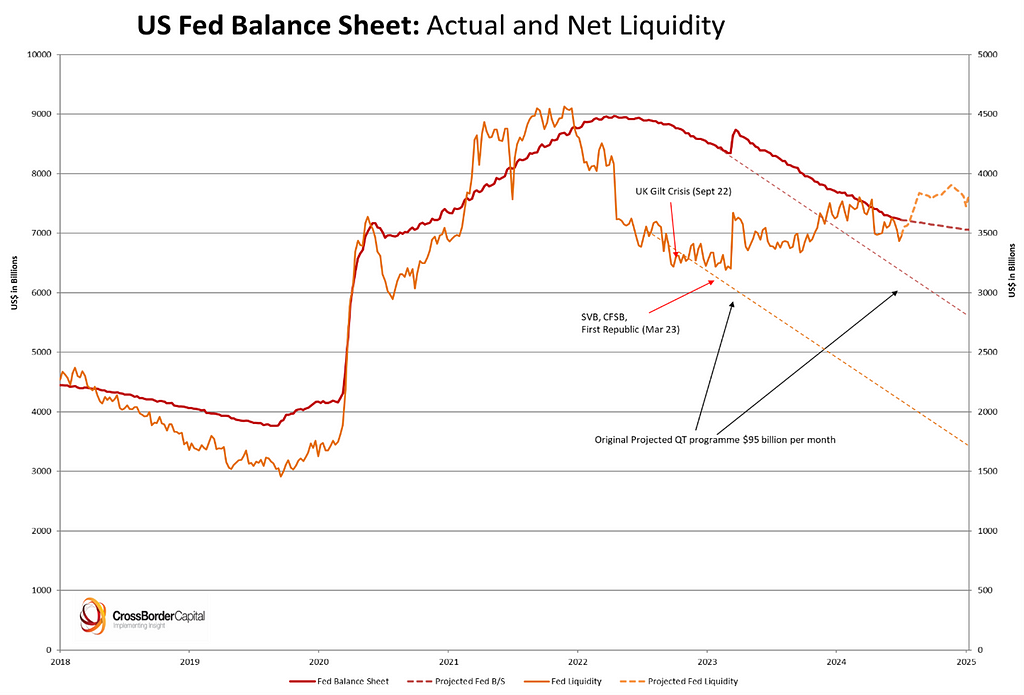
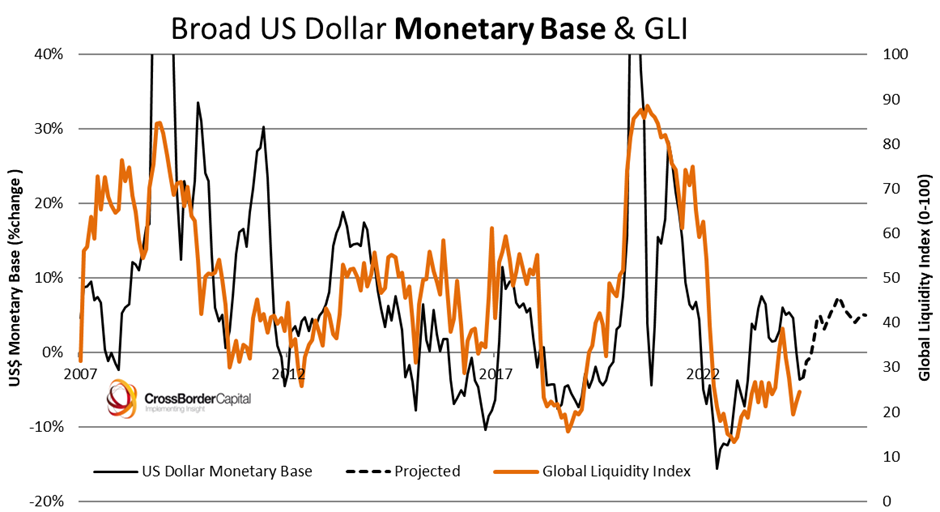
Future projections of Fed liquidity could impact the U.S. dollar monetary base, and by implication, the pattern of global liquidity. On current Fed policies, there is likely to be some uplift, but it looks modest.
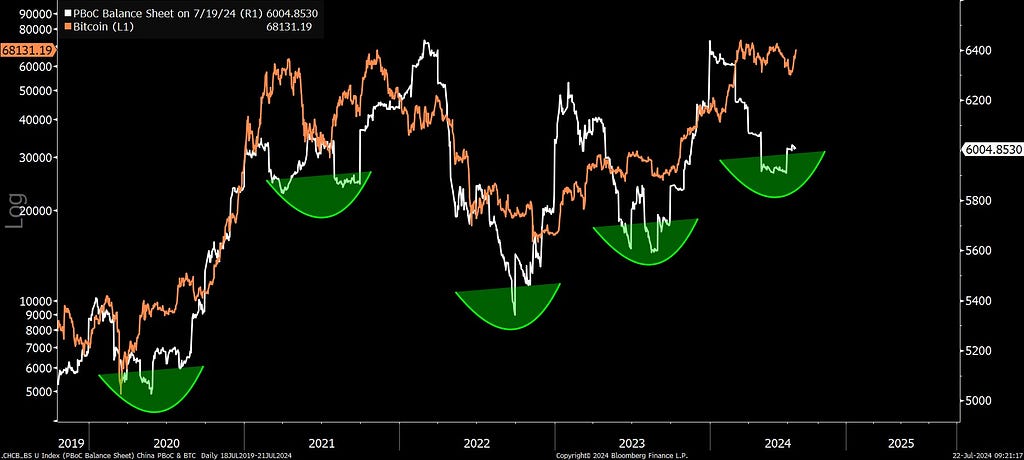
China and The People’s Bank (PBoC)
Finally, we must not ignore China. The People’s Bank (PBoC) controls the Chinese financial system, and given the importance of debt finance, the PBoC is a key influence on the tempo of the economy. U.S. dollar strength and weakness in the Chinese yuan have lately capped and even reversed recent PBoC monetary easing. China must allow its real exchange rate to devalue. A yuan devaluation would allow the PBoC a much-needed opportunity to ease liquidity policy. Already, there are some signs from the recent announcement of the widening in its range of policy instruments that the PBoC is planning to step up liquidity injections.
Future Policy Actions
Now, let’s look at future policy actions and their impact on global liquidity.
QE Projections
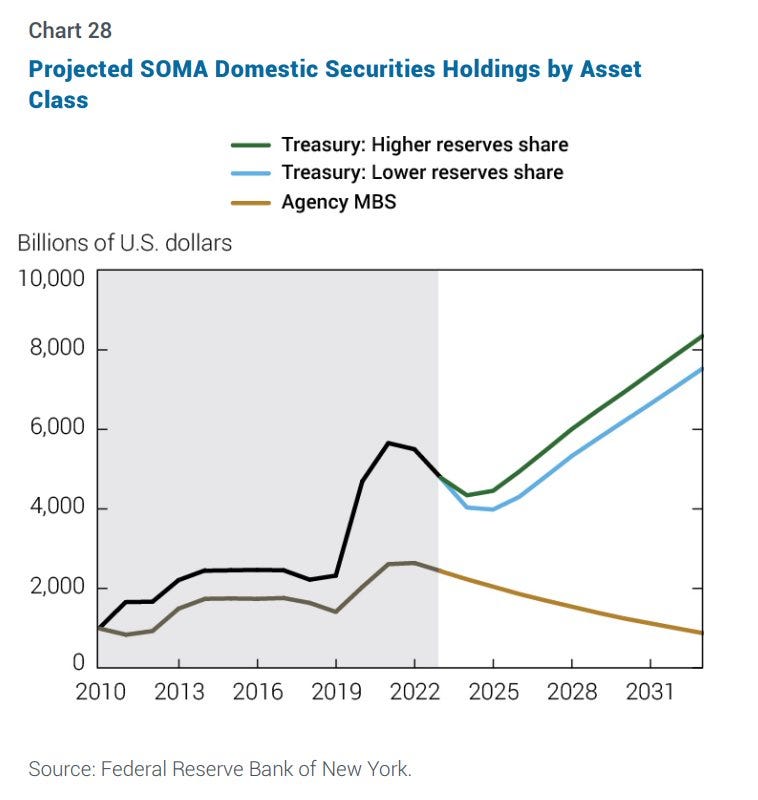
Anecdotally, many central banks want to ease. It seems like the U.S. Fed is the only one holding back. Fed projections released earlier this year estimated that QT will effectively stop at the end of 2024 and they’ll start buying Treasuries in the open market again. This is because of the need to keep bank reserves above a certain threshold.
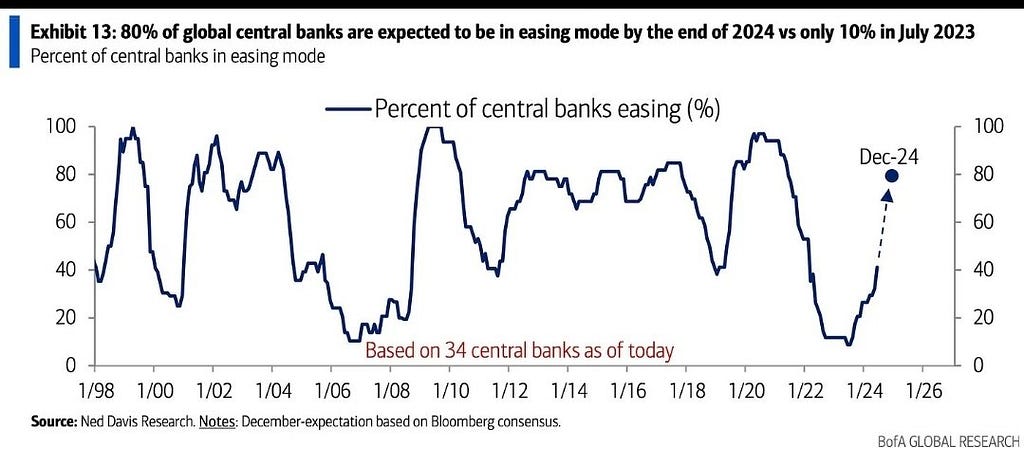
According to Bank of America research, 43% of 34 global central banks are already in quantitative easing mode, versus only 10% in July 2023, with consensus expectations projecting that 27 of 34 global central banks, or 80%, are expected to ease their monetary policy by the end of 2024.
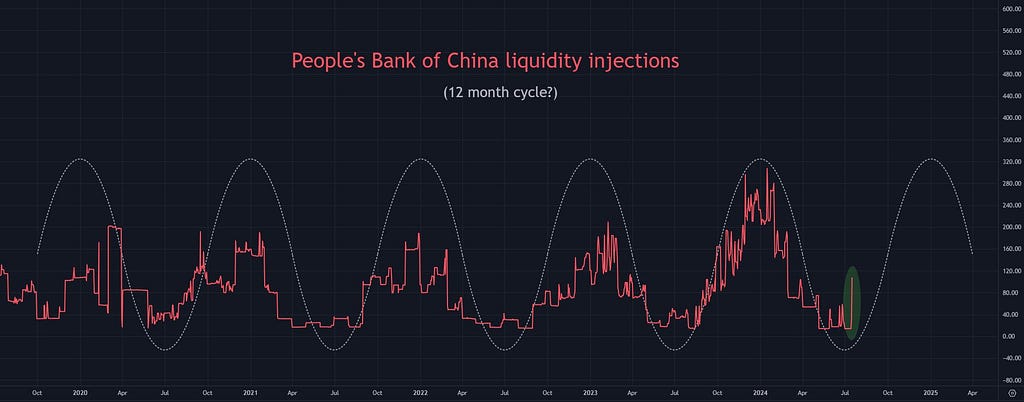
China also had a spike in liquidity three weeks ago due to a $93bn liquidity injection from the PBoC’s reverse repo facility. However, this is extremely short-term in nature and has not seen any follow-through. My current thoughts are that it’s still best to anticipate a repeat of the 12-month cycle trend — which has historically seen large liquidity injections starting around late August or early September.
Inflation
We are nearing the end of a rate hike cycle aimed at battling worldwide inflation caused by COVID-19 monetary policies. Worldwide, most countries are getting inflation under control, which is important to be able to bring interest rates back down.
Goldman Sachs’ Core Inflation Tracker is already under the 2% target,
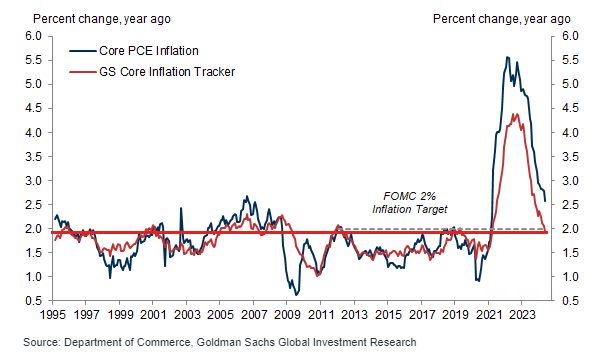
and real-time inflation estimates from Trueflation show dollar inflation continues to be below 2% as well. The reported numbers from the Fed look decent as well, with CPI at 2.74%, Core CPI at 3.38%, PCE at 2.45%, and Core PCE at 2.86%.
Here’s a snapshot of the inflation cycle over the past two years, broken down by component by JP Morgan.
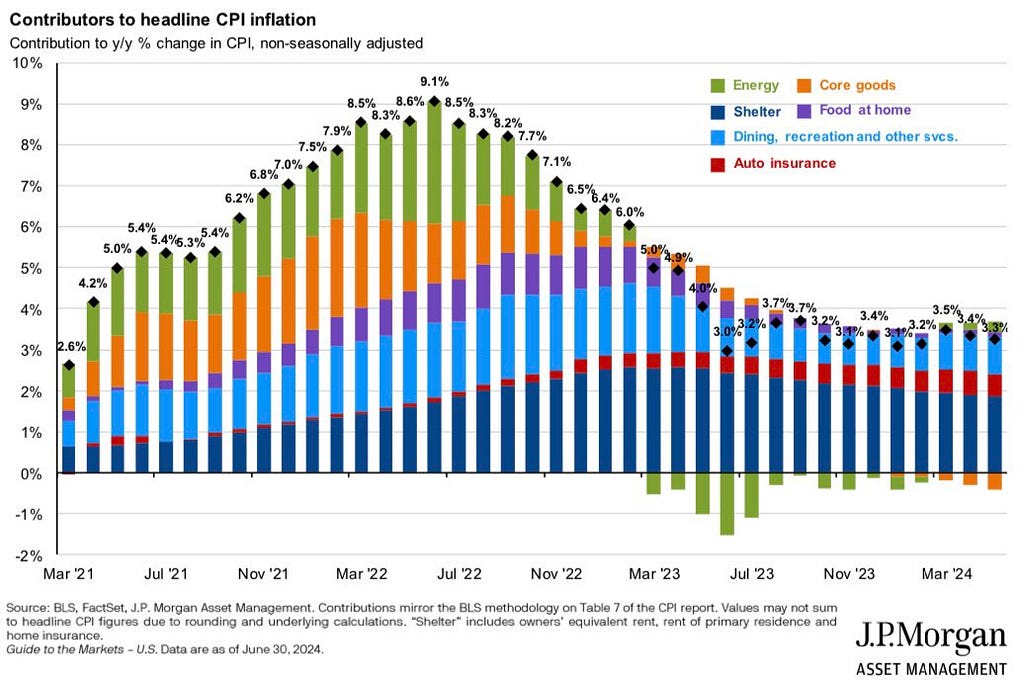
It seems like shelter is the biggest problem, but the rest seems to be under control.
Interest Rates
Given that the Fed has kept inflation under control, a weakening economy like this should definitely prompt the Fed to cut interest rates sooner rather than later, before we head into a recession. There are even calls for emergency rate cuts by many analysts following the stock market “crash” on Monday, August 5th, caused by the uptick in U.S. unemployment, the unwinding of the over-collateralized Yen carry trade, and the conflict in the Middle East.
Many central bankers have stated they will cut interest rates aggressively over the coming weeks and months to encourage capital spending and stimulate the economy. This will happen simultaneously worldwide, including the Fed, to avoid significant currency volatility and a strong dollar.
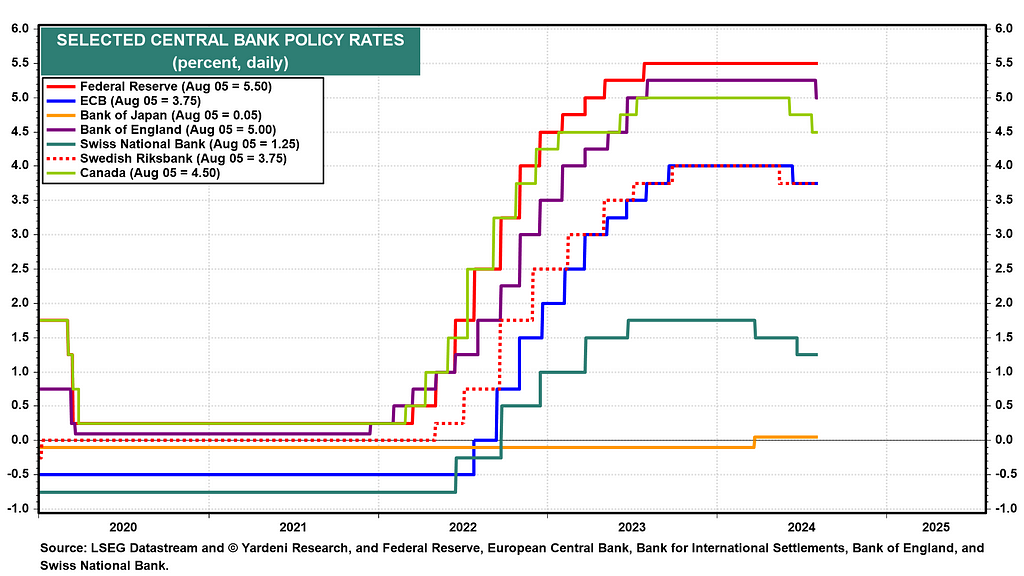
At the moment, we are in the early stages of a rate-cutting cycle. Last month, we saw five major central banks cutting their interest rates. The Bank of Canada cut rates for the second month in a row, decreasing by 25 basis points to 4.50%. The European Central Bank (ECB) announced a cut in its main interest rate from an all-time high of 4% to 3.75%. The Bank of England cut its rates by 25 basis points to 5%.
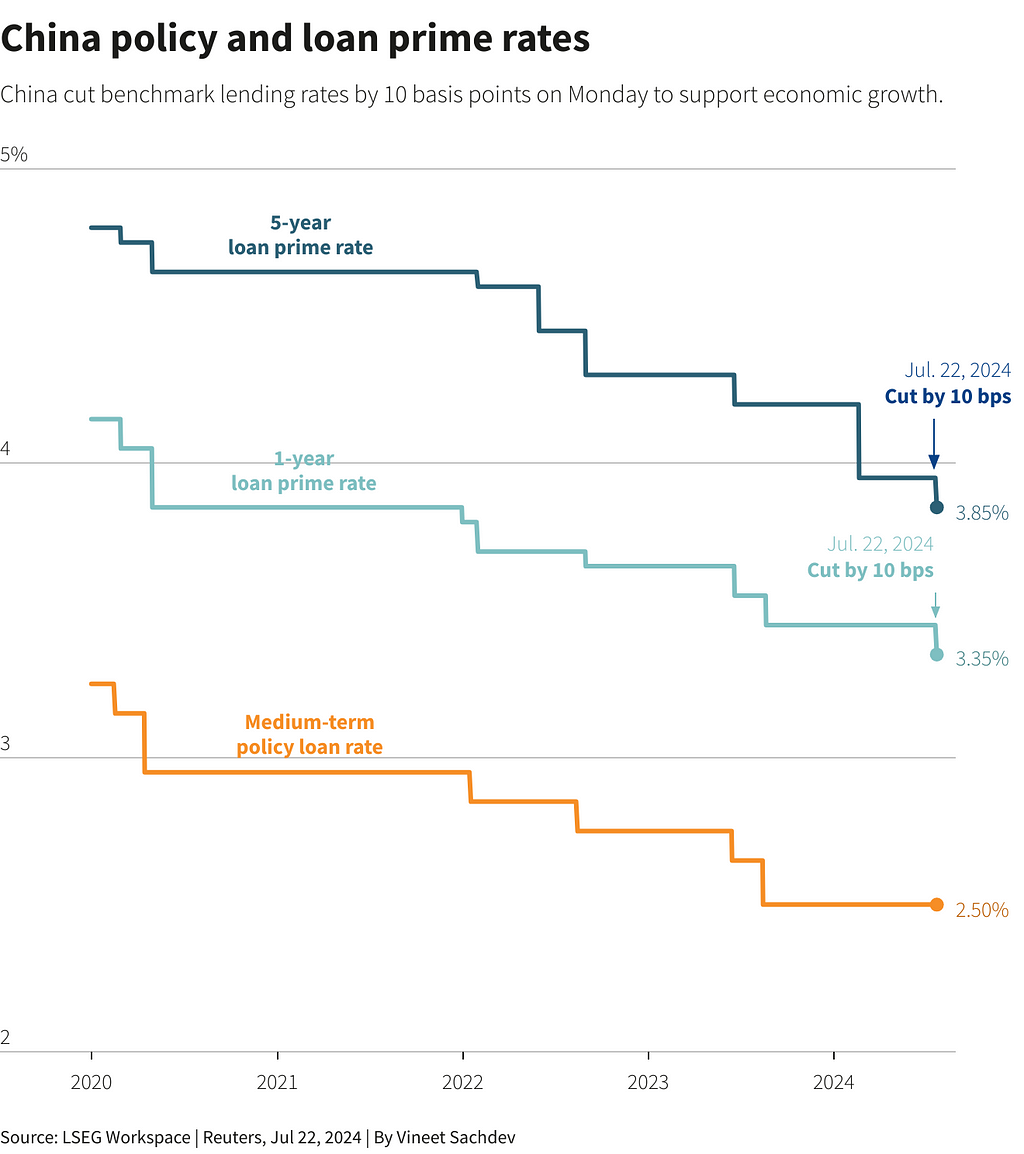
But more importantly, on July 22nd, China’s central bank cut key interest rates by 10 basis points.
Looking at the Global Central Banks Tracker from Macro Micro, we can clearly see the trend shifting towards cutting, with currently 49% of central banks cutting interest rates and rising.
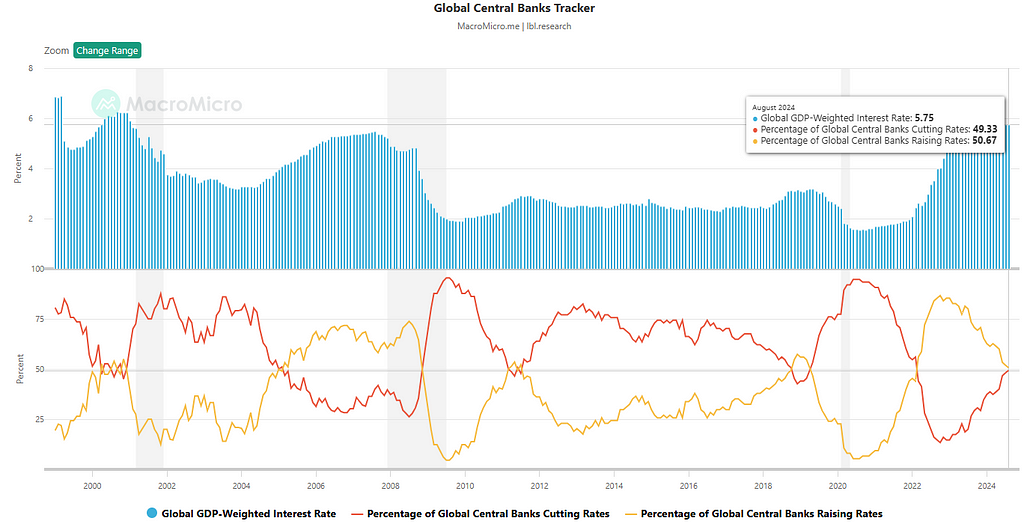
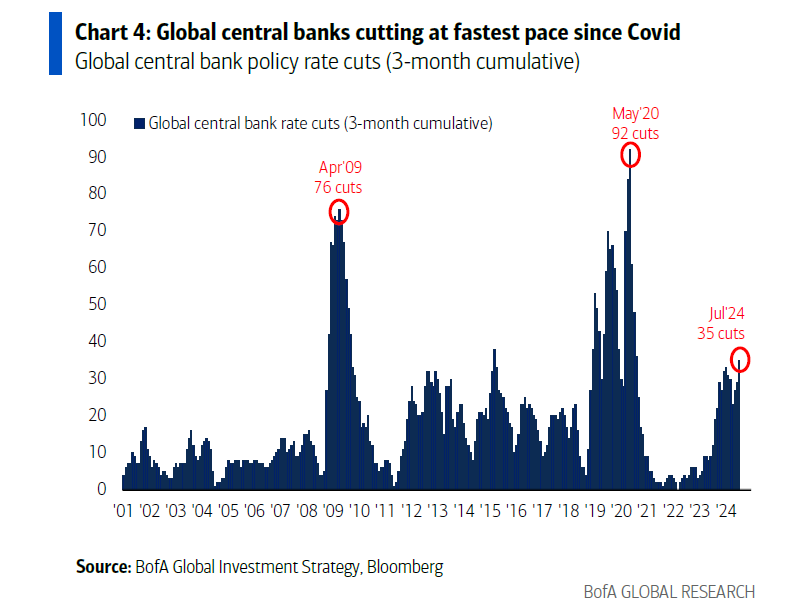
They are cutting rates at the fastest pace since Covid.
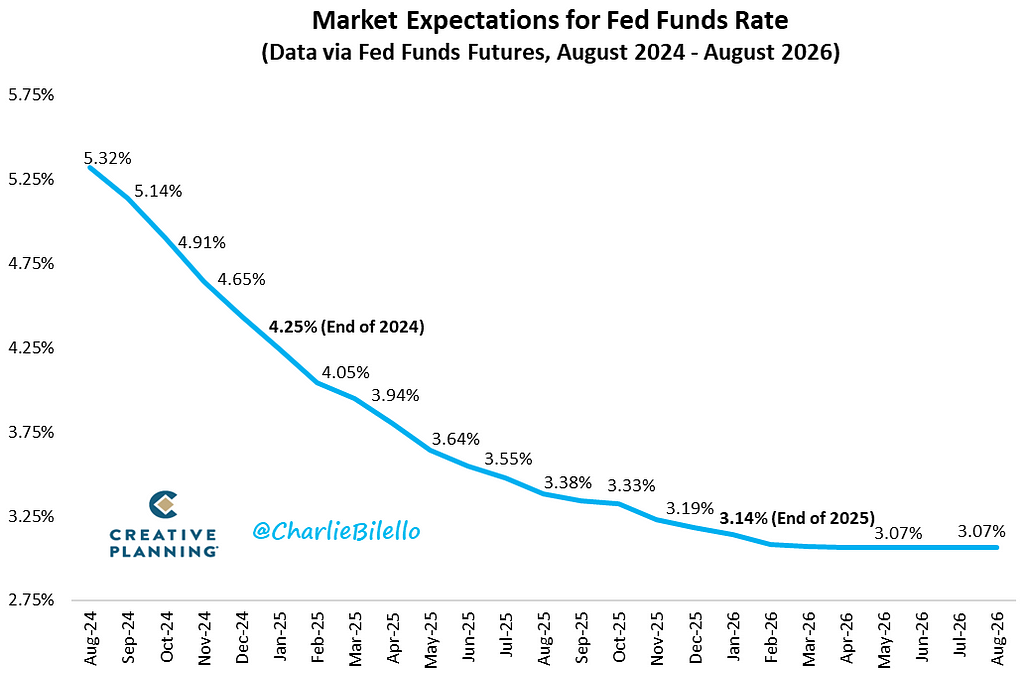
But the most important one is the U.S. Dollar. Based on the CME FedWatch Tool, the market is quite certain we will see a cut in September, with 2–3 more rate cuts before the end of the year and 4 more in 2025.
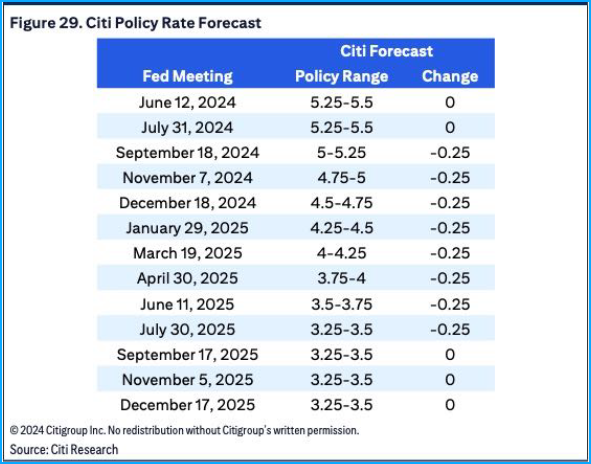
Major analysts predict the same, with Goldman Sachs expecting the first rate cut in September and a second cut in December. JPMorgan forecasts 50 bp cuts in both September and November. Citibank forecasts nine consecutive rate cuts starting from September to September 2025.
Fractional Reserve Banking
By lowering interest rates worldwide, more people will be able to lend more money, and new money will be created to lend out. Banks only keep a fraction of their depositors’ money in reserve and lend out the rest. This process repeats, with each cycle creating new money. This process, known as fractional reserve banking, expands the money supply exponentially and leads to high inflation. We saw this, for example, during the monetary inflation crisis in the 1970s, where most of the money creation back then was also from bank lending, resulting in stagflation. The best-performing investment asset back then was gold, a monetary hedge.
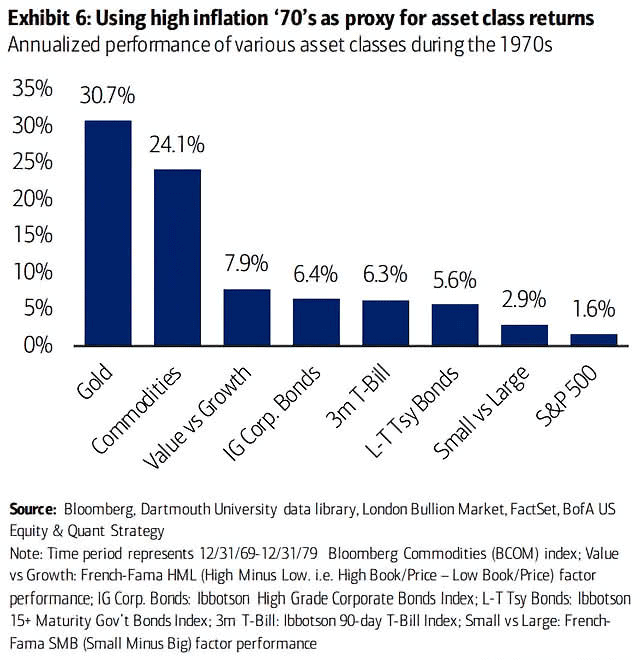
Bitcoin, due to its limited supply, also acts like a monetary hedge. The best way to escape the upcoming stagflation would be to buy a store of value outside of the system like, for example, Bitcoin — the digital exponential gold of this day and age.
U.S. Debt clock
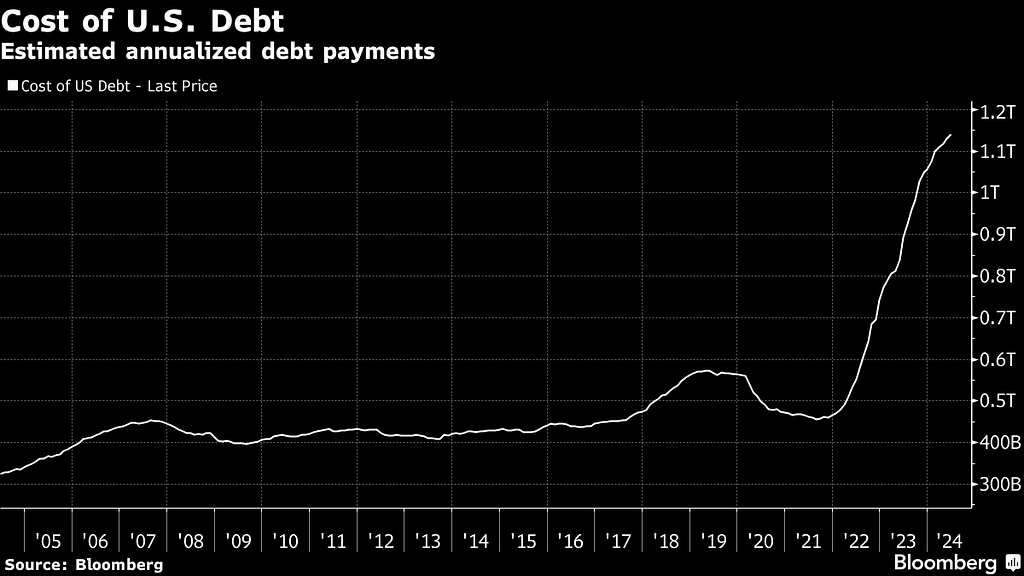
As more money is created through loans, the total amount of debt increases. The interest on this debt requires more money to be created to pay it off, with each round of borrowing and lending adding to the total money supply. Currently, annualized interest payments on U.S. federal debt have reached an all-time high of $1.14 trillion.
The U.S. government needs lower interest rates more than anyone to be able to more easily pay back the debt.
If the economy relies on continuous growth to avoid recession, the money supply must keep growing, leading to an exponential curve over time.
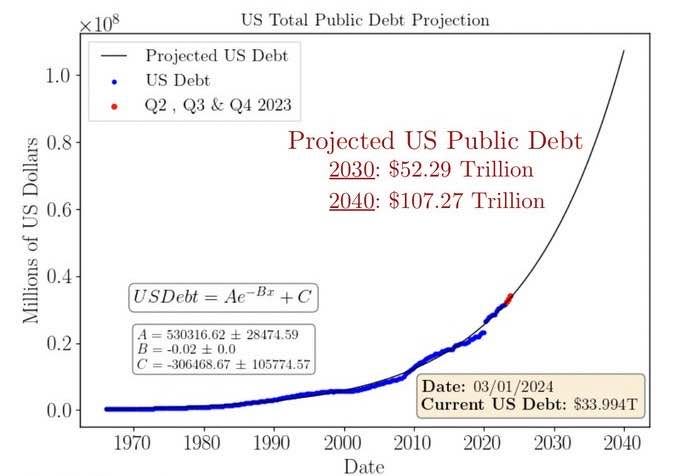
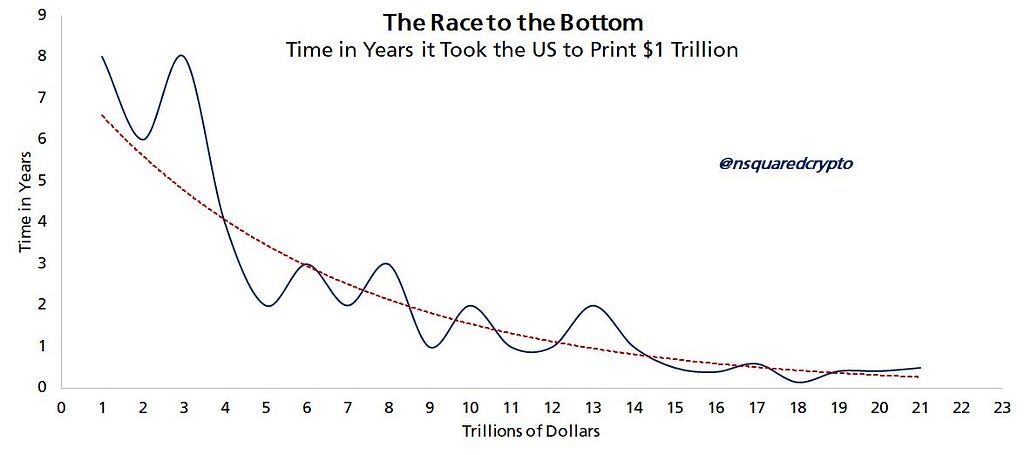
Currently, the U.S. M2 money supply is over $22 trillion. The money supply is growing exponentially, so the time it takes the U.S. to print $1 trillion is decelerating exponentially. At the current rate, $1 trillion will be added every 70 days, then every 50, then every 20. By the time the money supply has doubled to $44 trillion, the U.S. will be printing $1 trillion twice per week! This is expected to happen in 2025.
Global Liquidity Projections and Outlook
So, as you can understand by now, it appears that Bitcoin performs well when there is rapid growth in the broad measure of the global money supply (M2). This is driven by reductions in interest rates, quantitative easing, and fiscal stimulus.
Now the question arises: Where is global liquidity headed, and how can you profit from this as an investor? As I’ve just explained, throughout Q2, we have had short-term negative liquidity growth in the U.S.,
with the Fed tightening liquidity, the People’s Bank of China tightening its monetary policy since the end of the Lunar New Year to stabilize the yuan, and the majority of central banks still not cutting interest rates. All this caused global liquidity to decrease and dragged Bitcoin down with it.
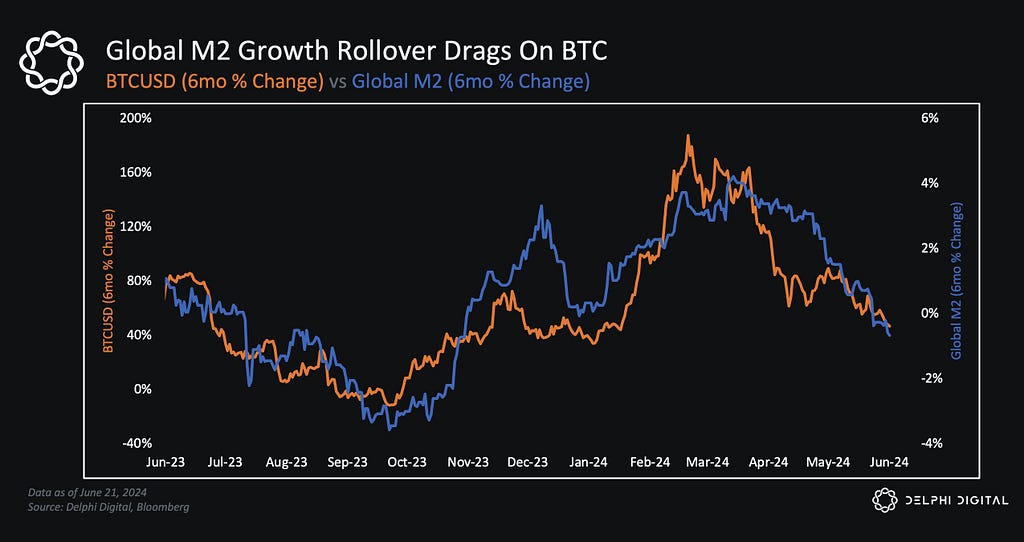
But this will all change this quarter. Currently, we start to see a positive YoY % change in global liquidity (roughly 4%).
This increase is attributed to the decline of the MOVE index, the rapid weakening of the US dollar (DXY), a surge in the value of collateral (Treasuries) and a significant surge in liquidity injections from China’s reverse repo injections.
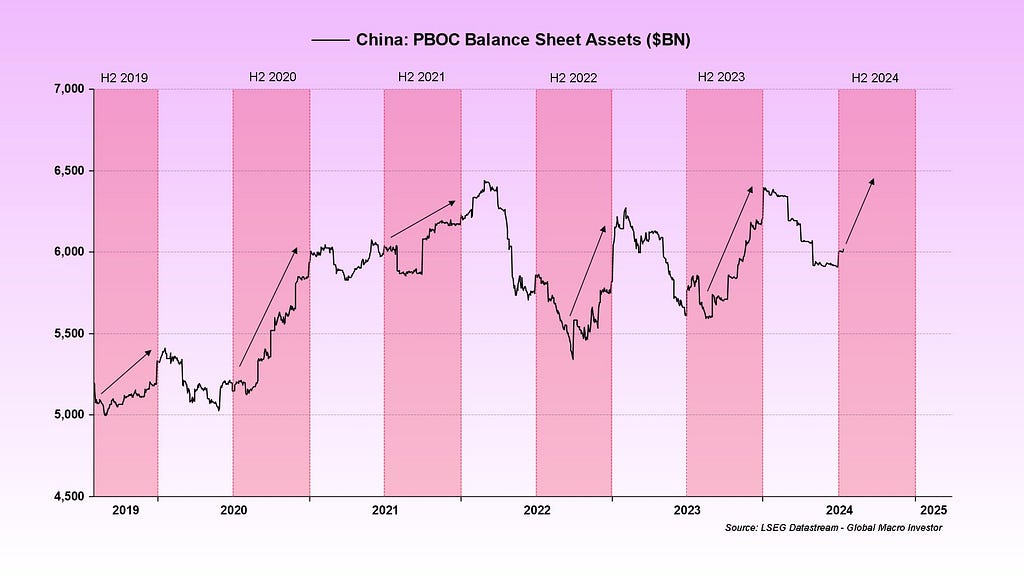
Going back to 2016, these injections by the PBoC have seen Bitcoin appreciate by at least 100% in the following months.
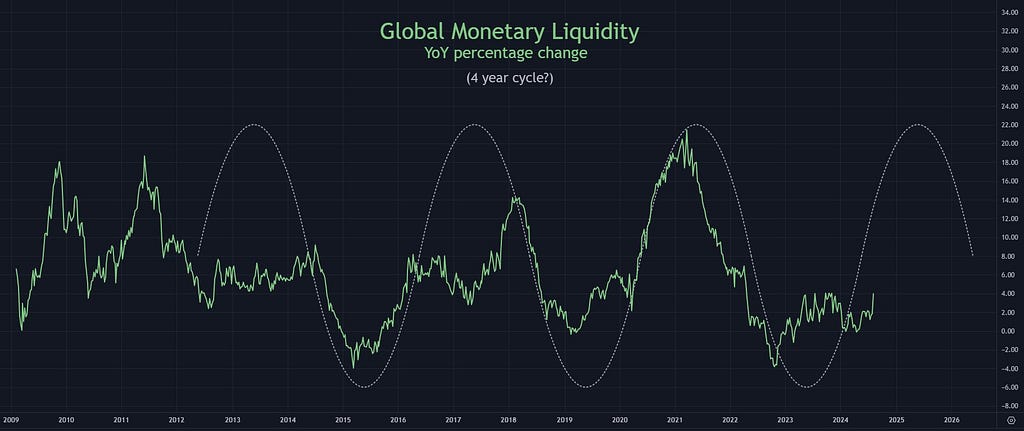
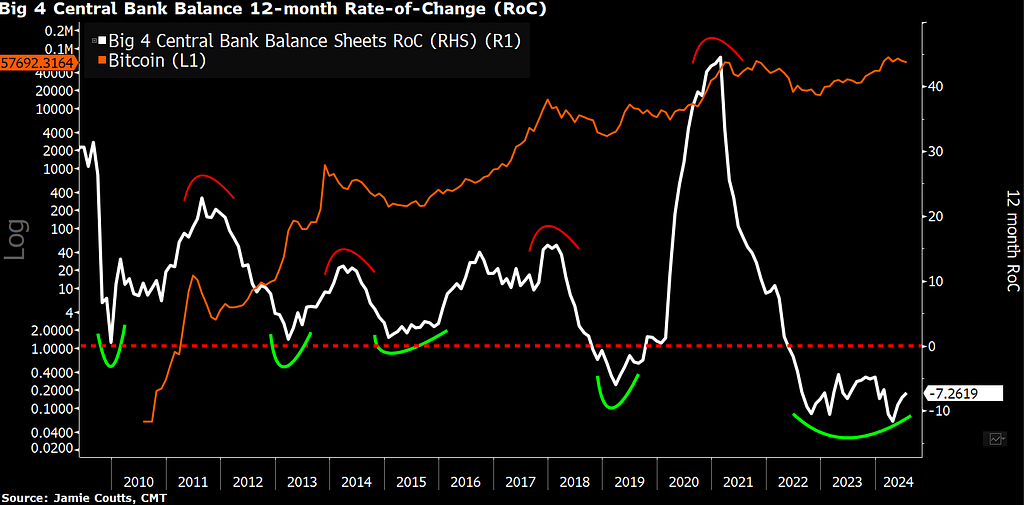
According to Michael Howell from Crossborder Capital, the king of global liquidity, his projection shows that the global liquidity cycle bottomed in October 2022 and that global liquidity is set to surge in the second half of this year, with the Fed’s balance sheet expected to rise at an annualized rate of 20%. We’ll probably see that happening in the period leading up to the U.S. election, with more monetary stimulus from the Fed through the balance sheet.
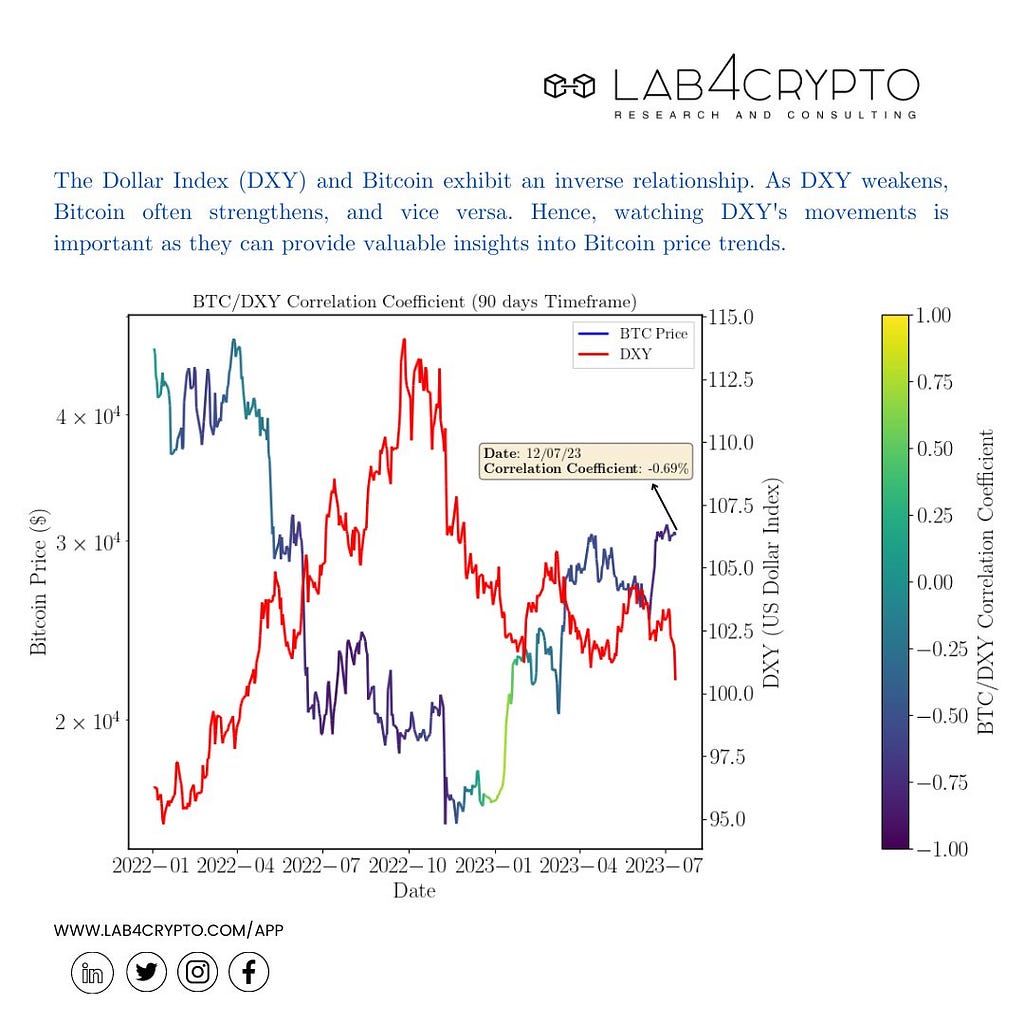
The U.S. also doesn’t want a dollar this strong and will not want a repeat of the March 2023 regional banking turmoil, especially not before the November elections. This, in turn, is good for Bitcoin, as the dollar index has been generally inversely correlated with the price of Bitcoin.
Even after the elections, the outlook for Bitcoin remains positive. Pro-Bitcoin candidate Donald Trump wants a weaker dollar, which will boost exports and create more jobs. This will lead to higher prices for gold, silver, Bitcoin, stocks, and real estate.
Howell expects Global liquidity to expand until its next peak sometime around late-2025.
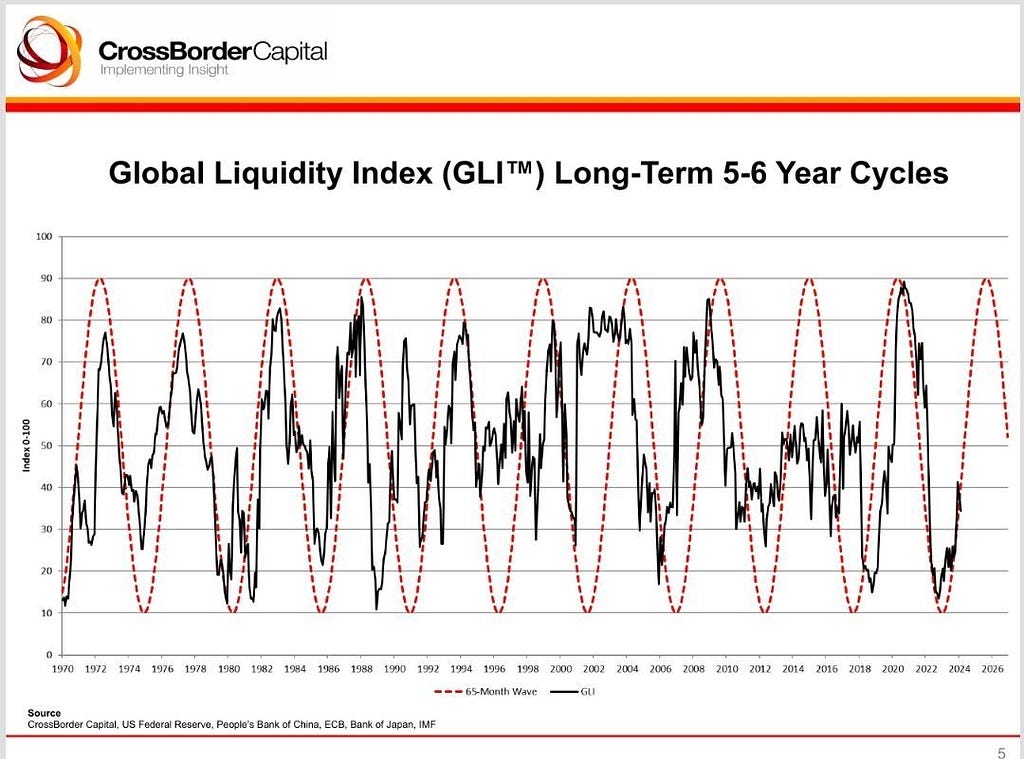
Which would align with when the Bitcoin cycle top is usually in. which is historically always been, 15-18 months after the halving.
Investing Based on Global Liquidity Shifts
So, if global liquidity trends play out as described, how can you position yourself as an investor?
Howell’s research concluded that Bitcoin lags global liquidity by around 8 to 12 weeks.
As an investor at this stage in the global liquidity cycle, I am very optimistic about the long-term prospects for Bitcoin since liquidity is returning. This generally appears to be a good time to invest in Bitcoin.
Now, when should you sell?
Unless you’re a day trader, keep it simple: sit tight and do nothing for now.
Sell around Q3/Q4 2025. That’s when the global liquidity expansion is expected to peak, which aligns with when the Bitcoin halving cycle top usually is.
We’re in a debt refinancing cycle, which means we need liquidity to roll over existing debt. For the U.S. dollar system to function, it must continue to grow, or it will fall into a recession, meaning credit must keep getting extended. This leads to exponential money supply expansion. That’s why, over the next decade, we’re likely to see higher than normal, very sticky inflation for a long time.
The bubble everyone is talking about is in the sovereign debt market, not in the stock market or housing market. Hard assets like Bitcoin are likely your best solution against this monetary bubble we’re in.
Make sure to follow me on Twitter (X) where I post daily updates and analyses on the crypto market @JackGreenCrypto
How Global Liquidity Drives Bitcoin’s Price + Current Outlook was originally published in The Dark Side on Medium, where people are continuing the conversation by highlighting and responding to this story.
from The Dark Side - Medium https://ift.tt/a087Pmw


0 Comments