Check out our new platform — https://thecapital.io/
Global markets are stable after Thursday’s liquidation, but the foam continues to come out of overheated technology names, according to investing. The U.S. is expected to add 1.4 million jobs in August, but many of them are one-off hires for the 2020 census.
The United States government will not close in October, and oil prices soared after a brief panic over global oversupply.
On the Ethereum side, it was no different. The market correlation is so strong that this asset immediately reacted to the drop in prices. That is why in the next lines we want to present you a complete analysis and in all timeframes and the new ball of market called DeFi and according to the last Binance report.
Healthy Correction
So far Ethereum has corrected approximately 28% since its last rally. On the hourly chart, a new phase of reaccumulation can begin between 368 and 391; zone bounded by the EMA200 and the EMA300 respectively.
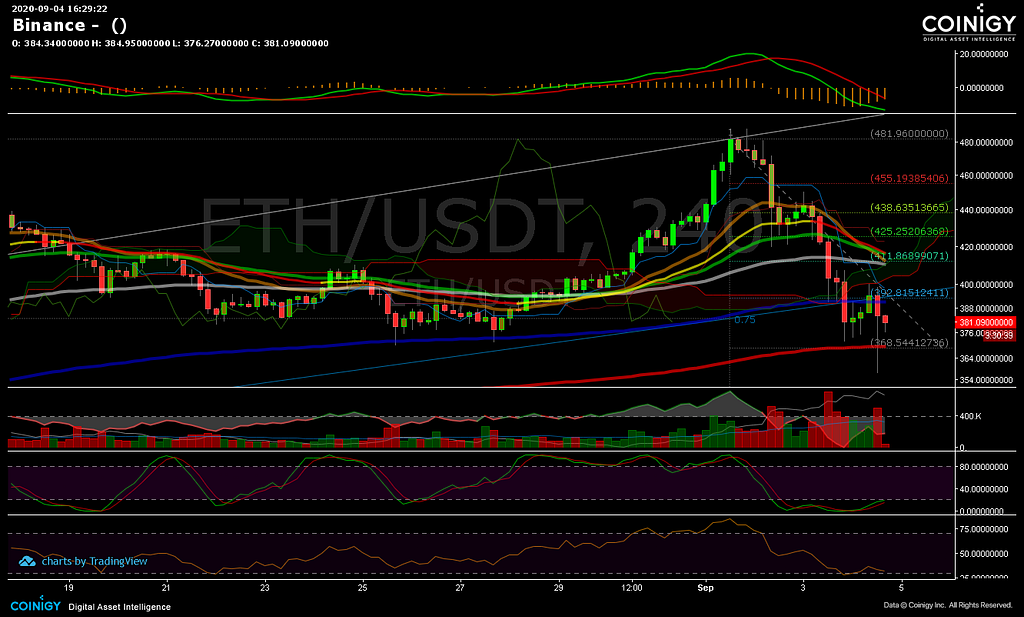
Indicators begin to show reversal signals, marking the asset as oversold. We don’t recommend a positive long input yet. It is very necessary to wait first for the reversal of Bitcoin that so far is being analyzed with the closing of the GAP of the CME at approximately 9850.
Perfect Geometry
Within the daily chart, Ethereum maintains a perfect symmetric behavior within an inverse symmetric triangle that progressively shows the accumulation zone with an approximate variation of 30%.
After the market crash and with the break of the EMA9 at 404 and the EMA34 as a trend factor at 389, the price was supported by the touch of the EMA50 at 369.
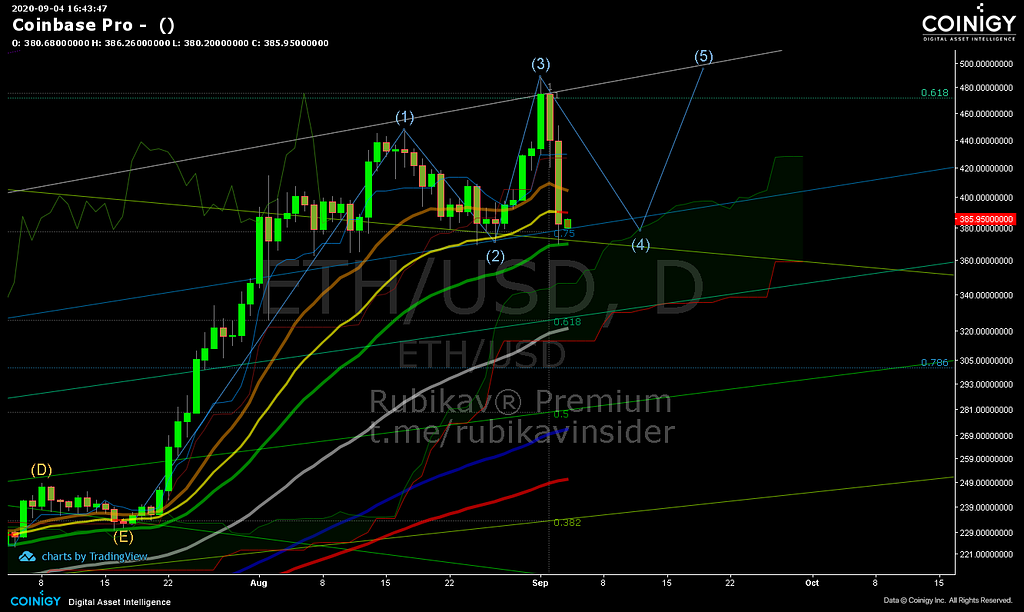
A healthy correction preceded by the completion of a possible wave 3 and with the touch of 0.6 Fibo at 471. Now we wait for the reversal of the possible wave 4 that could go to test the breaking of strong resistance at 495 and 500 where everyone has already placed their next sell target.
Indicators begin to show price lateralization but with a tendency to continue the correction of values.
Continuity Path
The Ethereum itch rally after the announcement of version 2.0, which we already anticipated and are very sorry, will be officially launched at the next event. Final point.

Also, that rally was preceded by the break of the highs of waves 1 and 3 within the weekly chart and was stronger when it broke the barrier of the 0.7 Fibo resistance at 302. Price currently supported by tenkan sen at 385.
Formally we have an accumulation of price within what would be a megaphone within the area 378 and 476. Extension of wave 5 can reach up to 600 after the market makes its sentimental reversal.
Clear Trajectory
Doing a long-term analysis of Ethereum within the monthly chart, we can see that we are in an Elliot wave 1 that we believe will end with the breakdown of the historical mass well above 1k.
So far our trajectory and until the end of the next bullrun points up to 10k, according to Elliot’s trajectory and the following Fibo levels, along with what would be the next.
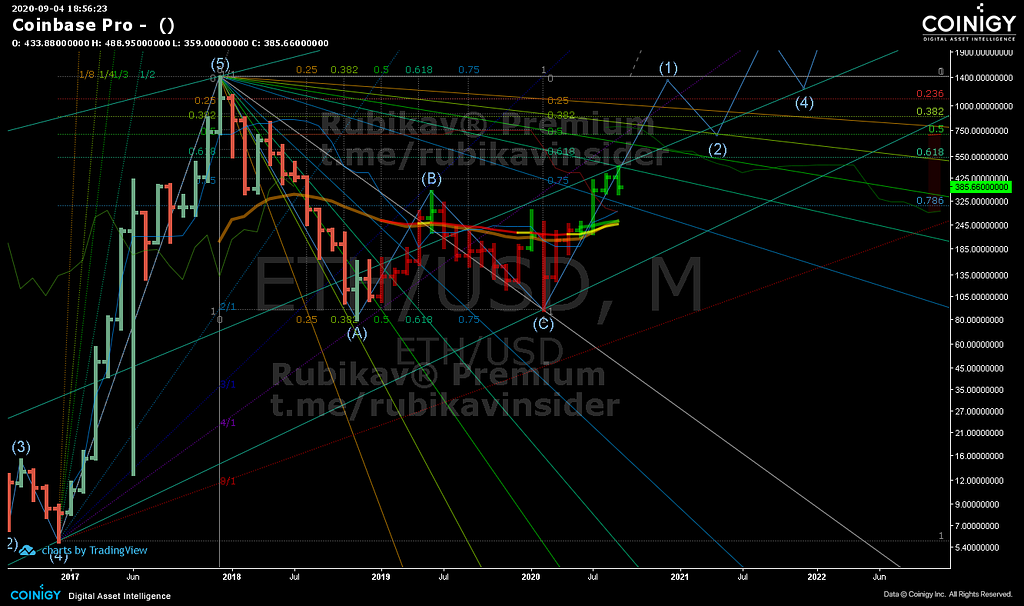
For now, we have Tenkan Sen cross with Kijun Sen at 288 as mitigating support towards an extreme short-term price correction alongside the 21, 34, and 50 EMAs within the 254 and 247 price range.
With the breaking of the 0.75 Fibo retraction line, we can point out that Ethereum within this timeframe may be accumulating the next months between 309 and 546.
Balloon Dominance
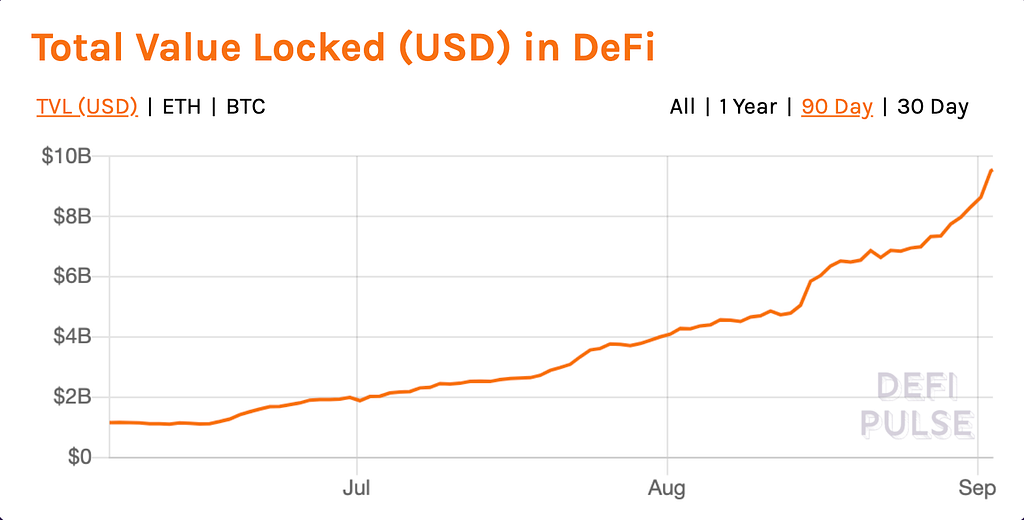
According to the last Binance Report, DeFi sector continued its parabolic run in August, as the Total Value Locked (TVL) in the ecosystem surpassed $9 billion. From our point of view, it is the new inflatable ball for the market.
Throughout the month, the DeFi uptrend has been unwavering. The Total Value Locked in DeFi jumped over 90% from $4.2 billion to over $8 billion as crypto funds poured in.
The race for DeFi dominance has grown more intense with Aave (LEND) overtaking Maker (MKR) to the number one position as its total assets surpassed Maker on August 31st. At press time, Aave dominance stood at 17.9% according to DeFi Pulse.
Market Killer
Another big mover in DeFi is Yearn.finance’s native governance token, YFI. Its market capitalization has grown 10 fold in just one month from $127 million to over $1.1 billion according to Coinmarketcap.
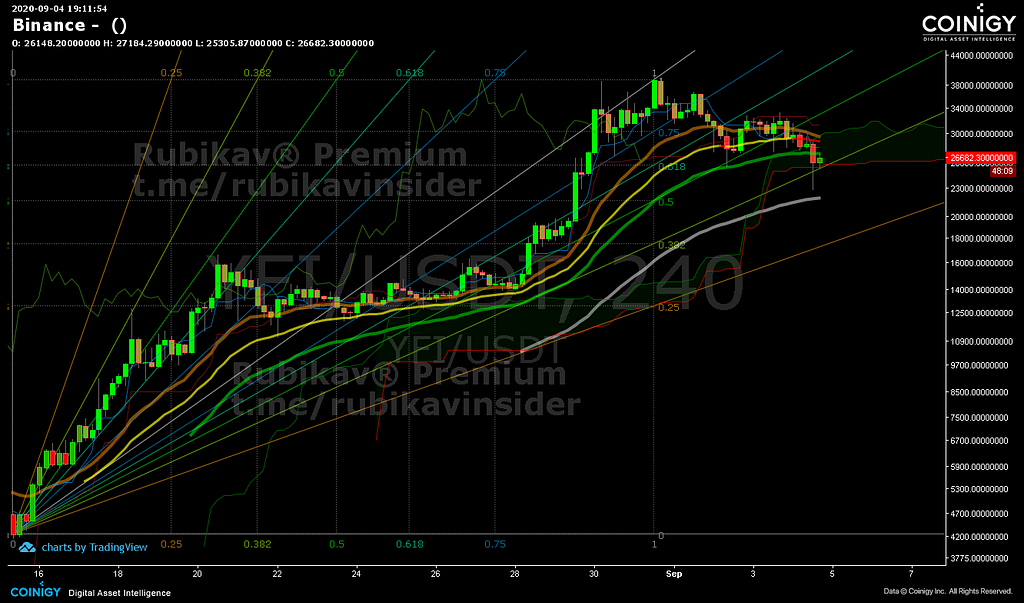
YFI’s exponential growth was mainly attributed to four major factors: Limited supply, strong and active community, reputable development team, and innovative products. A combination of the aforementioned factors and its transparent and decentralized launch garnered the attention of many DeFi enthusiasts since the beginning.
Bullish Market
Another thing that the Binance report says is that since its inception, the DeFi composite index on Binance has attracted interest from DeFi traders with volumes growing by the day. Currently, the index is projecting a highly bullish stance on the market.
According to data, more than 90% of the traders continue to hold long positions on DeFi despite the recent volatility. The data reflects investors’ bullish sentiment on the growth of the overall DeFi market.
Altcoin Futures High
Another point that says the report is that The DeFi boom has caused a surge in trading volume on Altcoin futures contracts across major exchanges. At the beginning of August, aggregated volume marked a new record with over $20 billion in Altcoin volume traded across major exchanges, its highest in recent months.
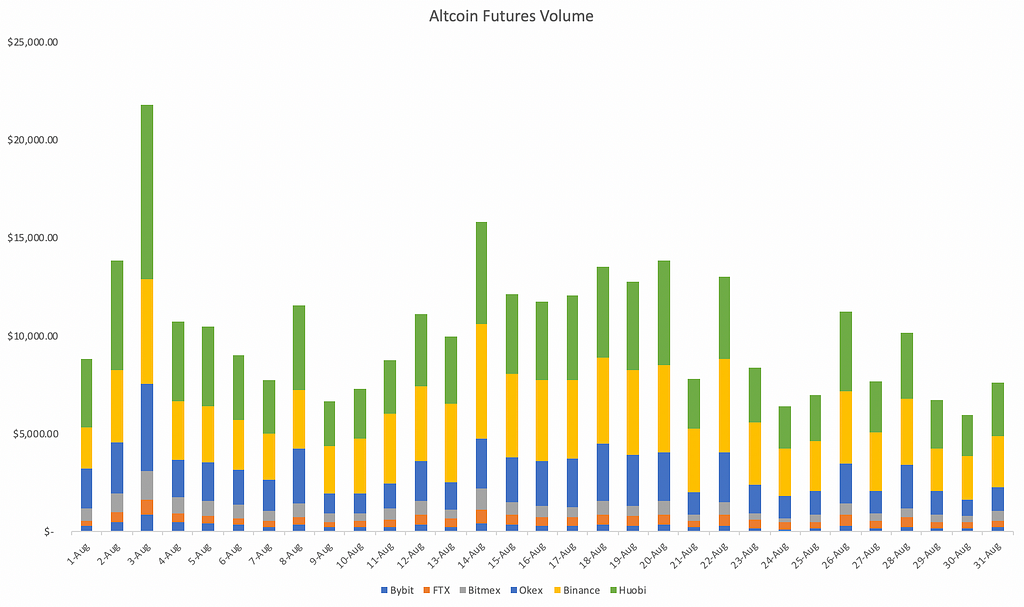
Binance marked one of its highest single-day altcoin futures volume on August 14th, with over $5.8 billion traded. Daily volume across altcoin futures averaged at $3.4 billion, positioning it as one of the leading exchanges for altcoins.
This was shown in Binance’s growing altcoin market share throughout August. The changing altcoin futures landscape has been largely attributed to Binance Futures’ continuous effort in expanding its product range of futures contracts to provide enhanced diversification and better hedging options for its users.
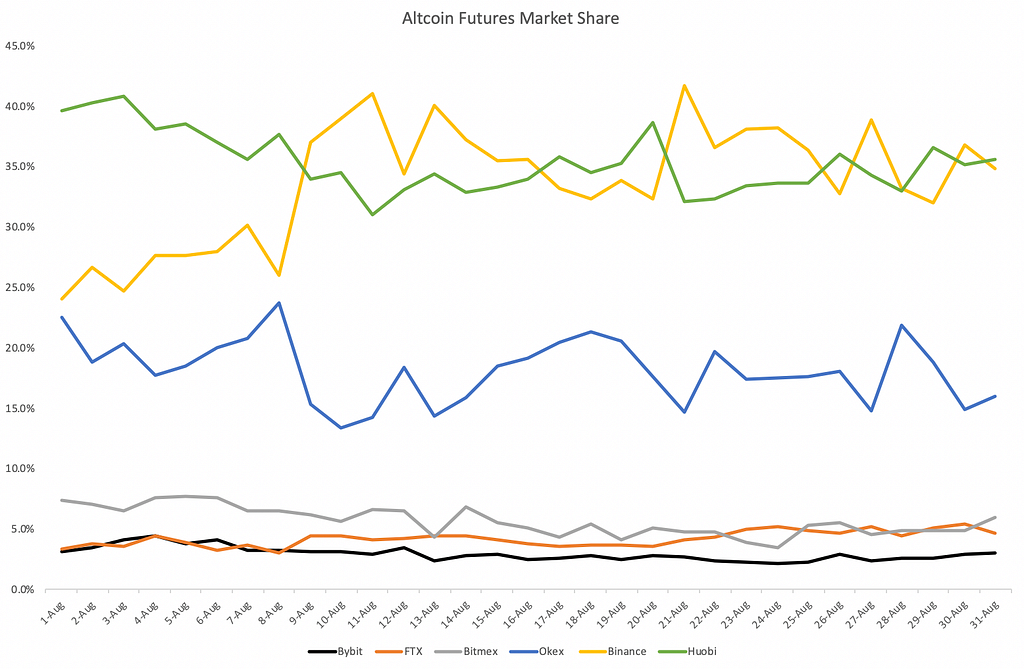
In August, Binance’s market share in the Altcoin futures space grew as high as 41% and stabilized in the range of 35–40% towards the month-end. Increased interest in contracts such as DOT, OMG, WAVES, and LEND has helped catapult Binance’s market share to new heights.
Volume Growth
Also, Binance says that Owing to the rise in trading activity, volume on Binance Futures increased by 79% month-on-month to $195 billion, its highest monthly volume since inception. Binance Futures displayed a daily average volume of $6.3 billion.
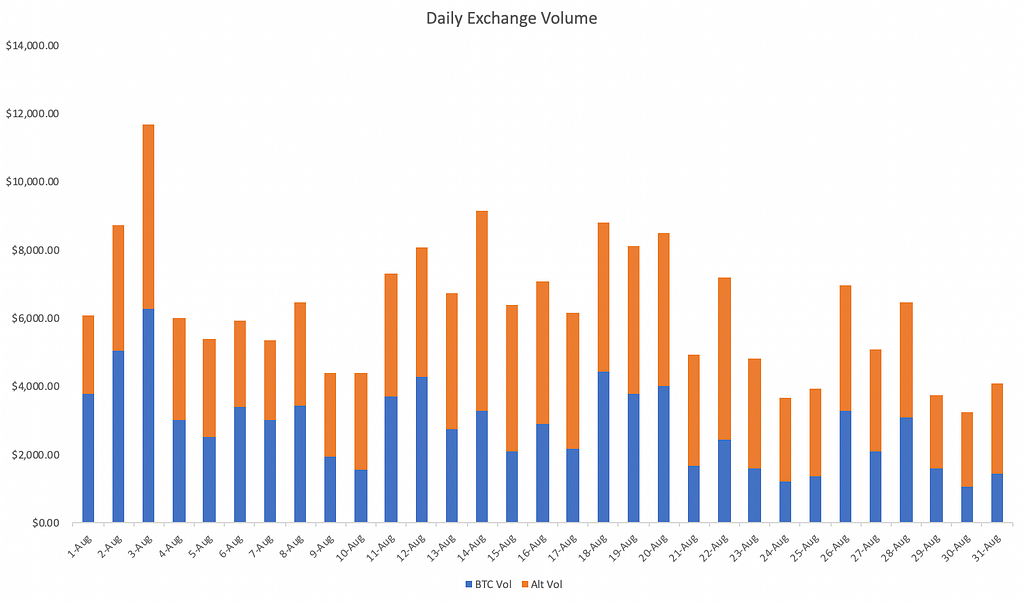
A significant portion of the volume growth is attributed to Altcoin contracts as traders shift their attention towards Altcoins, in particular, DeFi-related cryptocurrencies. As shown in the chart below, Bitcoin’s volume dominance declined throughout the month, while Altcoin volume grew.
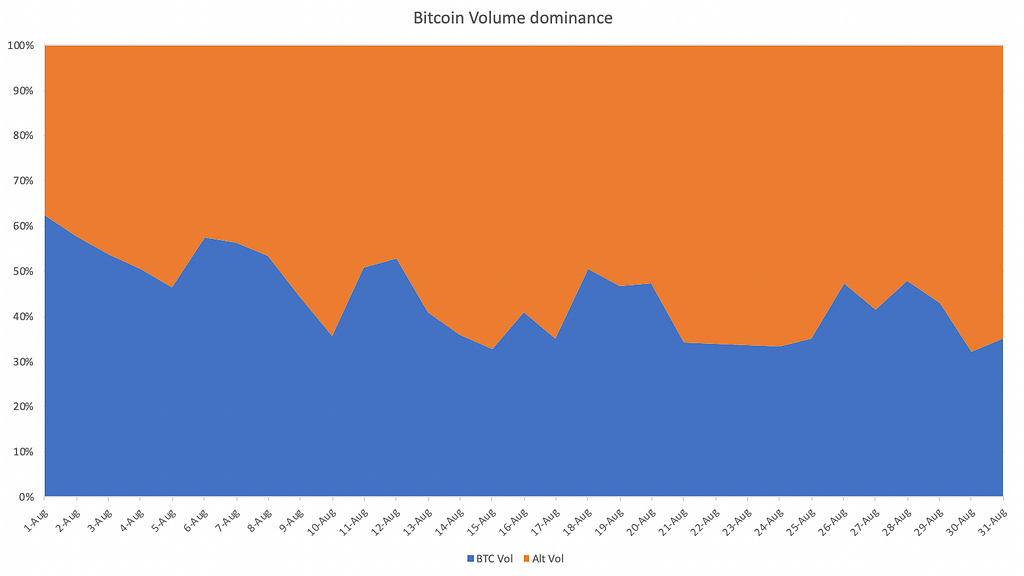
The Altcoin volume dominance grew from 38% to 68% towards the month-end, averaging at 53% in August. In comparison, the average percentage of Altcoin volume in July was 45%.
Billion Interest
The most surprising thing that Binance says in its report is that As Bitcoin surged to $12,000 at the beginning of August, open interest on Binance crossed $1 billion for the first time since its inception.
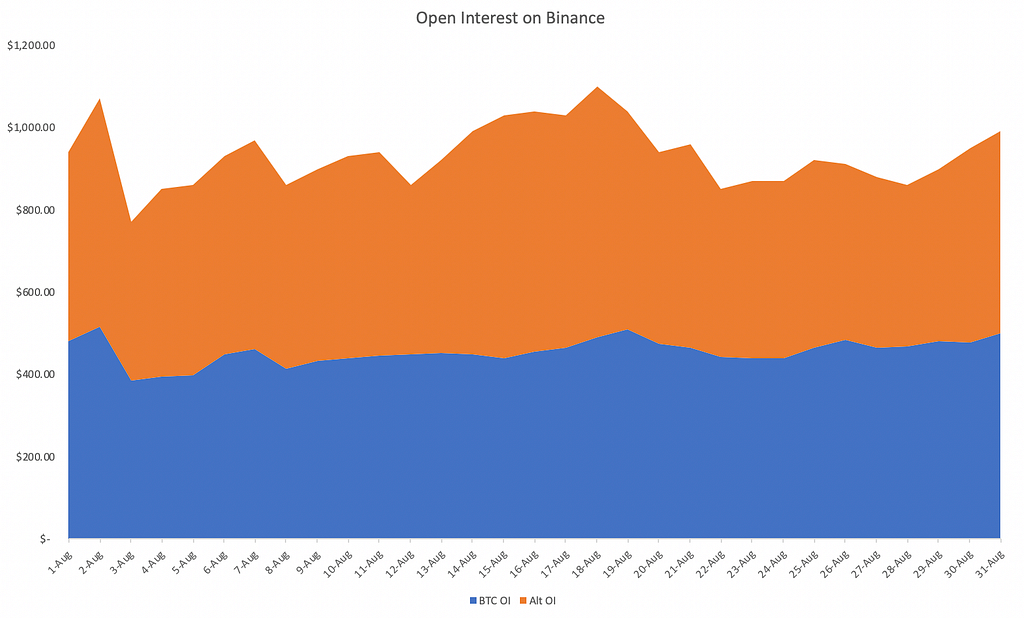
In mid-august, open interest crossed $1 billion again as Bitcoin attempted to break above $12,400. Since then, open interest has stabilized despite the short correction across crypto markets. In fact, the average daily open interest in August has grown to $950 million, a 35% increase vs. $700 million in July.
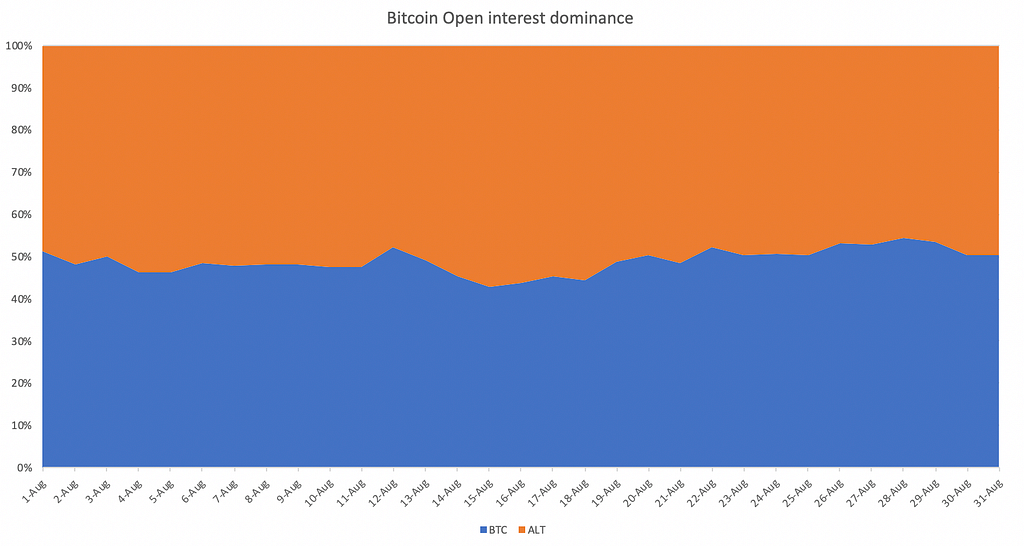
Interestingly, Bitcoin’s open interest remained stable despite the lack of trading activity. In fact, Bitcoin’s open interest in Binance gradually grew towards month-end, this may suggest that traders are positioning long-term directional bets on Bitcoin.
Let us know what you liked the most about this article in the comment box.
See you in the next story! With love 💛 Rubikav® Team!
Join on our Telegram Community Channel @rubikavinsider.
Follow us on Twitter, TradingView, Coinigy, Facebook, Uptrennd, Medium, Publish0x, & Instagram.
Crypto Wallets that we recommend to use: Coinbase, Exodus, Atomic Wallet, Enjin Wallet, and Trust Wallet.
Crypto Exchanges that we use to trade: Binance, Binance Futures, Bybit, Derebit, Kucoin, Bittrex, And Houbi Global With Cornix Auto Trade Bot.
https://twitter.com/thecapital_io
Premium Ethereum Technical Fundamental Analysis After Market Crash was originally published in The Capital on Medium, where people are continuing the conversation by highlighting and responding to this story.
from The Capital - Medium https://ift.tt/3308Vbd
0 Comments